OrientCarb 506579 full analysis,charts,indicators,moving averages,SMA,DMA,EMA,ADX,MACD,RSIOrient Carb 506579 WideScreen charts, DMA,SMA,EMA technical analysis, forecast prediction, by indicators ADX,MACD,RSI,CCI BSE stock exchange
Daily price and charts and targets OrientCarb Strong Daily Stock price targets for OrientCarb 506579 are 158.65 and 162.55 | Daily Target 1 | 155.5 | | Daily Target 2 | 157.9 | | Daily Target 3 | 159.4 | | Daily Target 4 | 161.8 | | Daily Target 5 | 163.3 |
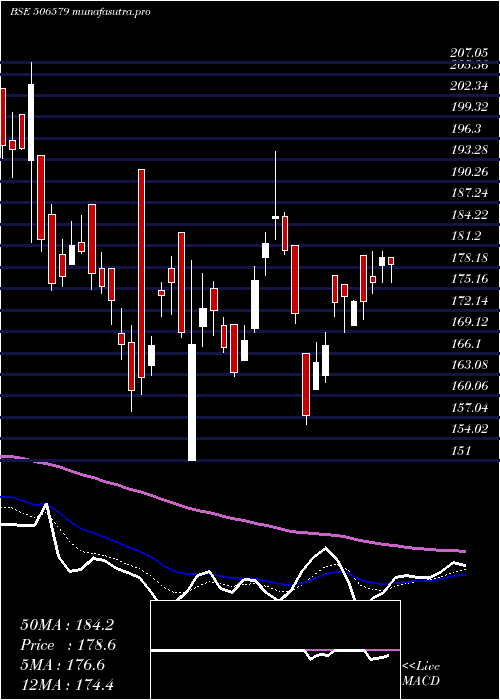
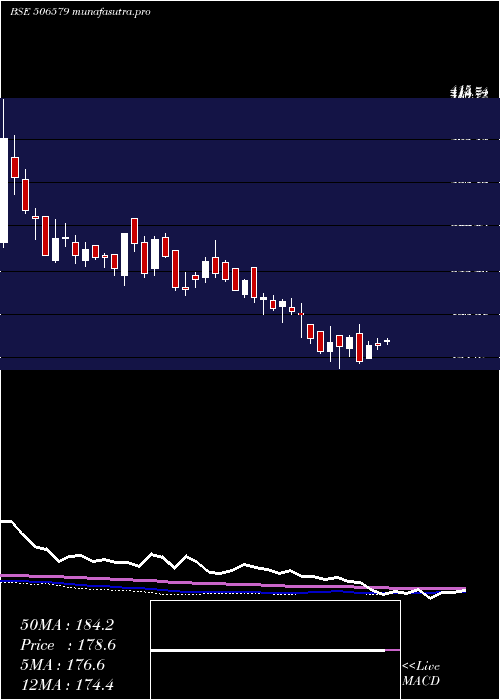
Daily price and volume Orient Carb
| Date |
Closing |
Open |
Range |
Volume |
Tue 21 October 2025 |
160.30 (1.26%) |
157.00 |
157.00 - 160.90 |
0.1843 times |
Mon 20 October 2025 |
158.30 (0.86%) |
157.10 |
157.10 - 162.90 |
0.9429 times |
Fri 17 October 2025 |
156.95 (0.26%) |
156.40 |
156.40 - 160.00 |
1.2549 times |
Thu 16 October 2025 |
156.55 (-1.07%) |
157.50 |
156.00 - 161.65 |
0.7875 times |
Wed 15 October 2025 |
158.25 (0.09%) |
158.65 |
156.50 - 160.80 |
0.7042 times |
Tue 14 October 2025 |
158.10 (-1.95%) |
161.10 |
153.70 - 161.15 |
1.4005 times |
Mon 13 October 2025 |
161.25 (-0.95%) |
162.80 |
160.00 - 162.85 |
1.1843 times |
Fri 10 October 2025 |
162.80 (-0.34%) |
164.95 |
160.00 - 165.85 |
1.1207 times |
Thu 09 October 2025 |
163.35 (0.34%) |
164.95 |
162.05 - 164.95 |
0.8197 times |
Wed 08 October 2025 |
162.80 (-1.78%) |
167.95 |
162.05 - 168.90 |
1.6011 times |
Tue 07 October 2025 |
165.75 (-0.24%) |
166.00 |
164.05 - 169.85 |
0.7101 times |
Weekly price and charts OrientCarb Strong weekly Stock price targets for OrientCarb 506579 are 158.65 and 164.55 | Weekly Target 1 | 154.17 | | Weekly Target 2 | 157.23 | | Weekly Target 3 | 160.06666666667 | | Weekly Target 4 | 163.13 | | Weekly Target 5 | 165.97 |
Weekly price and volumes for Orient Carb
| Date |
Closing |
Open |
Range |
Volume |
Tue 21 October 2025 |
160.30 (2.13%) |
157.10 |
157.00 - 162.90 |
0.2331 times |
Fri 17 October 2025 |
156.95 (-3.59%) |
162.80 |
153.70 - 162.85 |
1.1026 times |
Fri 10 October 2025 |
162.80 (-3.18%) |
169.00 |
160.00 - 169.85 |
1.0462 times |
Fri 03 October 2025 |
168.15 (-0.94%) |
169.85 |
162.00 - 170.00 |
0.9769 times |
Fri 26 September 2025 |
169.75 (-2.47%) |
175.00 |
166.00 - 177.50 |
0.8612 times |
Fri 19 September 2025 |
174.05 (-4.66%) |
182.25 |
173.55 - 182.25 |
1.295 times |
Fri 12 September 2025 |
182.55 (6.91%) |
171.95 |
168.15 - 183.95 |
1.0864 times |
Fri 05 September 2025 |
170.75 (4.21%) |
163.85 |
163.85 - 172.45 |
0.9159 times |
Fri 29 August 2025 |
163.85 (-12.78%) |
185.00 |
163.50 - 189.95 |
1.5299 times |
Fri 22 August 2025 |
187.85 (2.34%) |
184.00 |
176.00 - 194.40 |
0.9528 times |
Thu 14 August 2025 |
183.55 (7.46%) |
162.30 |
162.30 - 196.80 |
1.6927 times |
Monthly price and charts OrientCarb Strong monthly Stock price targets for OrientCarb 506579 are 148.93 and 165.08 | Monthly Target 1 | 145.13 | | Monthly Target 2 | 152.72 | | Monthly Target 3 | 161.28333333333 | | Monthly Target 4 | 168.87 | | Monthly Target 5 | 177.43 |
Monthly price and volumes Orient Carb
| Date |
Closing |
Open |
Range |
Volume |
Tue 21 October 2025 |
160.30 (-2.79%) |
164.90 |
153.70 - 169.85 |
0.6418 times |
Tue 30 September 2025 |
164.90 (0.64%) |
163.85 |
162.00 - 183.95 |
1.0456 times |
Fri 29 August 2025 |
163.85 (-28.9%) |
228.60 |
162.30 - 234.90 |
1.6019 times |
Thu 31 July 2025 |
230.45 (-3.48%) |
229.30 |
212.60 - 247.90 |
1.7321 times |
Mon 30 June 2025 |
238.75 (19.76%) |
203.00 |
203.00 - 329.05 |
2.9629 times |
Fri 30 May 2025 |
199.35 (16.07%) |
173.30 |
168.90 - 234.40 |
0.7542 times |
Wed 30 April 2025 |
171.75 (9.19%) |
160.90 |
160.90 - 185.60 |
0.1354 times |
Fri 28 March 2025 |
157.30 (-6.01%) |
167.55 |
151.00 - 194.40 |
0.4604 times |
Fri 28 February 2025 |
167.35 (-22.63%) |
210.95 |
165.25 - 219.55 |
0.3239 times |
Fri 31 January 2025 |
216.30 (-3.5%) |
228.95 |
196.15 - 249.90 |
0.3418 times |
Tue 31 December 2024 |
224.15 (-5.98%) |
240.00 |
221.00 - 277.10 |
0.647 times |

DMA SMA EMA moving averages of Orient Carb 506579
DMA (daily moving average) of Orient Carb 506579
| DMA period | DMA value | | 5 day DMA | 158.07 | | 12 day DMA | 160.88 | | 20 day DMA | 164.1 | | 35 day DMA | 168.93 | | 50 day DMA | 172.26 | | 100 day DMA | 201.89 | | 150 day DMA | 194.41 | | 200 day DMA | 197.15 | EMA (exponential moving average) of Orient Carb 506579
| EMA period | EMA current | EMA prev | EMA prev2 | | 5 day EMA | 159 | 158.35 | 158.38 | | 12 day EMA | 161 | 161.13 | 161.65 | | 20 day EMA | 163.8 | 164.17 | 164.79 | | 35 day EMA | 168.39 | 168.87 | 169.49 | | 50 day EMA | 173.1 | 173.62 | 174.25 |
SMA (simple moving average) of Orient Carb 506579
| SMA period | SMA current | SMA prev | SMA prev2 | | 5 day SMA | 158.07 | 157.63 | 158.22 | | 12 day SMA | 160.88 | 161.53 | 162.07 | | 20 day SMA | 164.1 | 164.71 | 165.49 | | 35 day SMA | 168.93 | 169.16 | 169.32 | | 50 day SMA | 172.26 | 172.65 | 173.27 | | 100 day SMA | 201.89 | 202.43 | 203.03 | | 150 day SMA | 194.41 | 194.45 | 194.48 | | 200 day SMA | 197.15 | 197.5 | 197.91 |
|
|
