KananiInd 506184 full analysis,charts,indicators,moving averages,SMA,DMA,EMA,ADX,MACD,RSIKanani Ind 506184 WideScreen charts, DMA,SMA,EMA technical analysis, forecast prediction, by indicators ADX,MACD,RSI,CCI BSE stock exchange
Daily price and charts and targets KananiInd Strong Daily Stock price targets for KananiInd 506184 are 2.11 and 2.16 | Daily Target 1 | 2.07 | | Daily Target 2 | 2.09 | | Daily Target 3 | 2.1166666666667 | | Daily Target 4 | 2.14 | | Daily Target 5 | 2.17 |
Daily price and volume Kanani Ind
| Date |
Closing |
Open |
Range |
Volume |
Tue 15 July 2025 |
2.12 (-0.93%) |
2.09 |
2.09 - 2.14 |
2.2442 times |
Mon 14 July 2025 |
2.14 (0.47%) |
2.08 |
2.05 - 2.15 |
1.4839 times |
Fri 11 July 2025 |
2.13 (0.95%) |
2.10 |
2.10 - 2.15 |
0.5384 times |
Thu 10 July 2025 |
2.11 (-0.94%) |
2.15 |
2.08 - 2.15 |
1.0241 times |
Wed 09 July 2025 |
2.13 (-0.47%) |
2.09 |
2.09 - 2.15 |
0.3466 times |
Tue 08 July 2025 |
2.14 (0.47%) |
2.16 |
2.10 - 2.16 |
0.5481 times |
Mon 07 July 2025 |
2.13 (0.95%) |
2.07 |
2.06 - 2.16 |
1.6988 times |
Fri 04 July 2025 |
2.11 (-1.4%) |
2.06 |
2.06 - 2.17 |
1.6666 times |
Thu 03 July 2025 |
2.14 (0.47%) |
2.10 |
2.10 - 2.17 |
0.2154 times |
Wed 02 July 2025 |
2.13 (0.47%) |
2.10 |
2.10 - 2.16 |
0.234 times |
Tue 01 July 2025 |
2.12 (0%) |
2.13 |
2.10 - 2.15 |
0.1638 times |
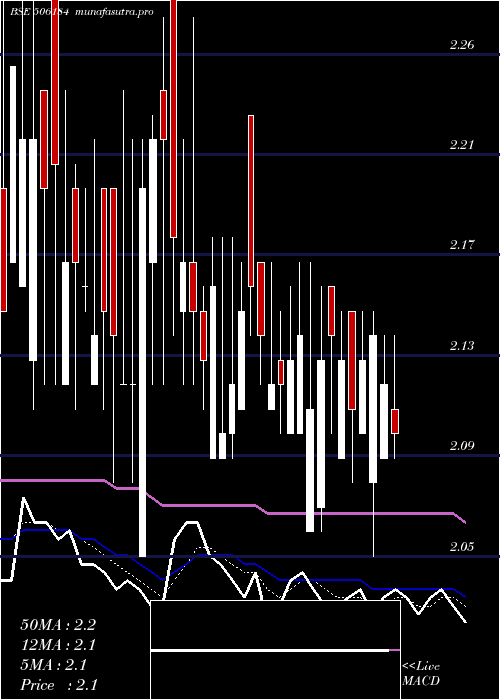
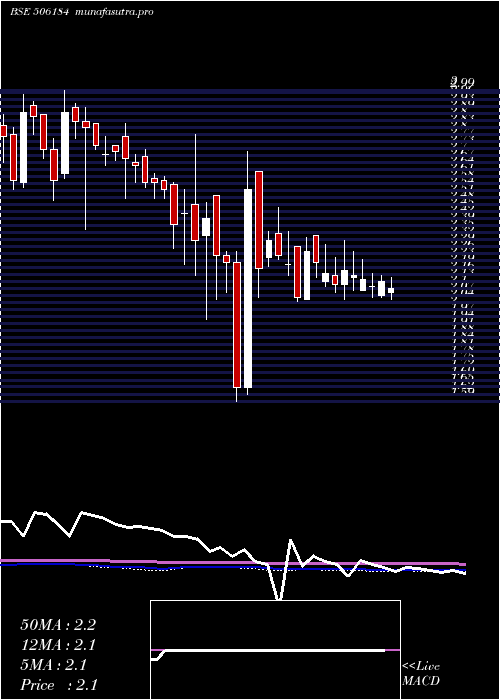
Weekly price and charts KananiInd Strong weekly Stock price targets for KananiInd 506184 are 2.09 and 2.19 | Weekly Target 1 | 2.01 | | Weekly Target 2 | 2.06 | | Weekly Target 3 | 2.1066666666667 | | Weekly Target 4 | 2.16 | | Weekly Target 5 | 2.21 |
Weekly price and volumes for Kanani Ind
| Date |
Closing |
Open |
Range |
Volume |
Tue 15 July 2025 |
2.12 (-0.47%) |
2.08 |
2.05 - 2.15 |
1.312 times |
Fri 11 July 2025 |
2.13 (0.95%) |
2.07 |
2.06 - 2.16 |
1.4626 times |
Fri 04 July 2025 |
2.11 (-1.4%) |
2.11 |
2.06 - 2.17 |
0.9143 times |
Fri 27 June 2025 |
2.14 (-0.93%) |
2.09 |
2.09 - 2.23 |
0.6611 times |
Thu 19 June 2025 |
2.16 (-0.92%) |
2.15 |
2.09 - 2.27 |
0.5684 times |
Fri 13 June 2025 |
2.18 (2.83%) |
2.12 |
2.05 - 2.32 |
0.8193 times |
Fri 06 June 2025 |
2.12 (-2.3%) |
2.16 |
2.08 - 2.24 |
0.4539 times |
Fri 30 May 2025 |
2.17 (-2.25%) |
2.13 |
2.11 - 2.30 |
1.9322 times |
Fri 23 May 2025 |
2.22 (-2.2%) |
2.34 |
2.15 - 2.34 |
0.668 times |
Fri 16 May 2025 |
2.27 (10.19%) |
2.05 |
2.05 - 2.33 |
1.2083 times |
Fri 09 May 2025 |
2.06 (-6.79%) |
2.29 |
2.04 - 2.29 |
0.9006 times |
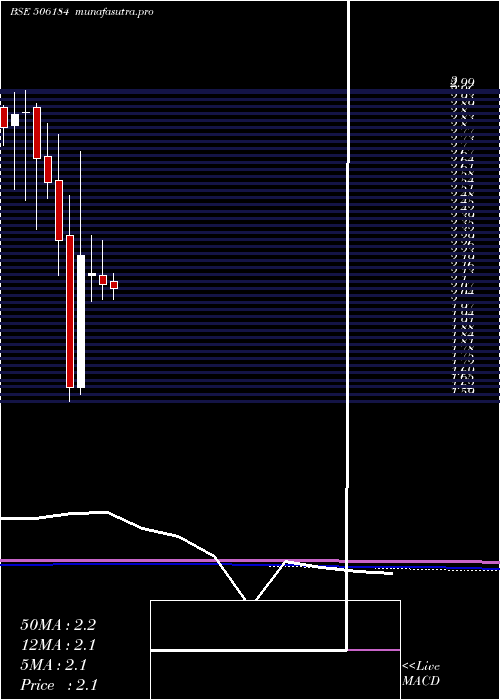
Monthly price and charts KananiInd Strong monthly Stock price targets for KananiInd 506184 are 2.03 and 2.15 | Monthly Target 1 | 1.99 | | Monthly Target 2 | 2.06 | | Monthly Target 3 | 2.1133333333333 | | Monthly Target 4 | 2.18 | | Monthly Target 5 | 2.23 |
Monthly price and volumes Kanani Ind
| Date |
Closing |
Open |
Range |
Volume |
Tue 15 July 2025 |
2.12 (0%) |
2.13 |
2.05 - 2.17 |
0.2493 times |
Mon 30 June 2025 |
2.12 (-2.3%) |
2.16 |
2.05 - 2.32 |
0.1823 times |
Fri 30 May 2025 |
2.17 (-3.56%) |
2.16 |
2.04 - 2.34 |
0.3367 times |
Wed 30 April 2025 |
2.25 (36.36%) |
1.65 |
1.62 - 2.72 |
1.9619 times |
Fri 28 March 2025 |
1.65 (-28.88%) |
2.34 |
1.59 - 2.52 |
1.3907 times |
Fri 28 February 2025 |
2.32 (-10.08%) |
2.59 |
2.16 - 2.80 |
1.0294 times |
Fri 31 January 2025 |
2.58 (-4.09%) |
2.70 |
2.51 - 2.85 |
0.7073 times |
Tue 31 December 2024 |
2.69 (-7.24%) |
2.92 |
2.37 - 2.94 |
0.8454 times |
Fri 29 November 2024 |
2.90 (0.35%) |
2.90 |
2.50 - 3.00 |
2.2437 times |
Thu 31 October 2024 |
2.89 (2.12%) |
2.84 |
2.55 - 2.99 |
1.0533 times |
Mon 30 September 2024 |
2.83 (0.35%) |
2.83 |
2.63 - 3.10 |
1.867 times |
DMA SMA EMA moving averages of Kanani Ind 506184
DMA (daily moving average) of Kanani Ind 506184
| DMA period | DMA value | | 5 day DMA | 2.13 | | 12 day DMA | 2.13 | | 20 day DMA | 2.13 | | 35 day DMA | 2.15 | | 50 day DMA | 2.16 | | 100 day DMA | 2.22 | | 150 day DMA | 2.38 | | 200 day DMA | 2.49 | EMA (exponential moving average) of Kanani Ind 506184
| EMA period | EMA current | EMA prev | EMA prev2 | | 5 day EMA | 2.13 | 2.13 | 2.12 | | 12 day EMA | 2.14 | 2.14 | 2.14 | | 20 day EMA | 2.16 | 2.16 | 2.16 | | 35 day EMA | 2.18 | 2.18 | 2.18 | | 50 day EMA | 2.17 | 2.17 | 2.17 |
SMA (simple moving average) of Kanani Ind 506184
| SMA period | SMA current | SMA prev | SMA prev2 | | 5 day SMA | 2.13 | 2.13 | 2.13 | | 12 day SMA | 2.13 | 2.13 | 2.13 | | 20 day SMA | 2.13 | 2.13 | 2.14 | | 35 day SMA | 2.15 | 2.15 | 2.15 | | 50 day SMA | 2.16 | 2.16 | 2.16 | | 100 day SMA | 2.22 | 2.23 | 2.23 | | 150 day SMA | 2.38 | 2.39 | 2.39 | | 200 day SMA | 2.49 | 2.49 | 2.5 |
|
|
