IntellCap 506134 full analysis,charts,indicators,moving averages,SMA,DMA,EMA,ADX,MACD,RSIIntell Cap 506134 WideScreen charts, DMA,SMA,EMA technical analysis, forecast prediction, by indicators ADX,MACD,RSI,CCI BSE stock exchange
Daily price and charts and targets IntellCap Strong Daily Stock price targets for IntellCap 506134 are 14.38 and 15.13 | Daily Target 1 | 13.79 | | Daily Target 2 | 14.22 | | Daily Target 3 | 14.536666666667 | | Daily Target 4 | 14.97 | | Daily Target 5 | 15.29 |
Daily price and volume Intell Cap
| Date |
Closing |
Open |
Range |
Volume |
Fri 05 December 2025 |
14.66 (2.73%) |
14.29 |
14.10 - 14.85 |
0.1499 times |
Thu 04 December 2025 |
14.27 (-0.07%) |
14.57 |
13.74 - 14.80 |
0.529 times |
Wed 03 December 2025 |
14.28 (-3.97%) |
14.50 |
14.21 - 15.20 |
0.5627 times |
Tue 02 December 2025 |
14.87 (-4.25%) |
15.22 |
14.76 - 15.53 |
0.5893 times |
Mon 01 December 2025 |
15.53 (1.17%) |
15.35 |
15.21 - 15.89 |
0.6442 times |
Fri 28 November 2025 |
15.35 (-3.22%) |
15.85 |
15.35 - 15.85 |
0.1629 times |
Thu 27 November 2025 |
15.86 (1.28%) |
15.35 |
15.35 - 16.25 |
1.6591 times |
Wed 26 November 2025 |
15.66 (1.95%) |
15.51 |
15.15 - 15.81 |
1.749 times |
Tue 25 November 2025 |
15.36 (2.06%) |
14.75 |
14.68 - 15.37 |
1.5707 times |
Mon 24 November 2025 |
15.05 (-4.99%) |
16.23 |
15.05 - 16.23 |
2.3834 times |
Fri 21 November 2025 |
15.84 (3.46%) |
15.40 |
14.83 - 16.07 |
1.3138 times |
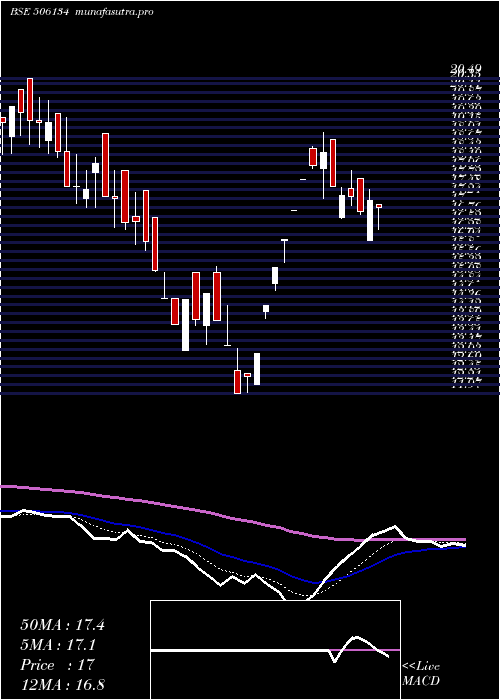
Weekly price and charts IntellCap Strong weekly Stock price targets for IntellCap 506134 are 13.13 and 15.28 | Weekly Target 1 | 12.61 | | Weekly Target 2 | 13.64 | | Weekly Target 3 | 14.763333333333 | | Weekly Target 4 | 15.79 | | Weekly Target 5 | 16.91 |
Weekly price and volumes for Intell Cap
| Date |
Closing |
Open |
Range |
Volume |
Fri 05 December 2025 |
14.66 (-4.5%) |
15.35 |
13.74 - 15.89 |
0.2399 times |
Fri 28 November 2025 |
15.35 (-3.09%) |
16.23 |
14.68 - 16.25 |
0.7295 times |
Fri 21 November 2025 |
15.84 (-2.88%) |
16.25 |
14.83 - 17.00 |
0.7141 times |
Fri 14 November 2025 |
16.31 (1.56%) |
16.60 |
15.12 - 16.65 |
0.3701 times |
Fri 07 November 2025 |
16.06 (-4.4%) |
16.38 |
15.02 - 17.00 |
0.7394 times |
Fri 31 October 2025 |
16.80 (6.6%) |
16.25 |
15.06 - 17.62 |
1.2007 times |
Thu 23 October 2025 |
15.76 (3.55%) |
15.55 |
14.95 - 16.30 |
0.3864 times |
Fri 17 October 2025 |
15.22 (-4.76%) |
16.05 |
14.50 - 16.30 |
0.3855 times |
Fri 10 October 2025 |
15.98 (-5.44%) |
16.90 |
15.60 - 17.19 |
0.6281 times |
Fri 03 October 2025 |
16.90 (6.83%) |
17.40 |
16.61 - 19.17 |
4.6064 times |
Fri 26 September 2025 |
15.82 (15.47%) |
13.80 |
12.70 - 15.82 |
1.7979 times |
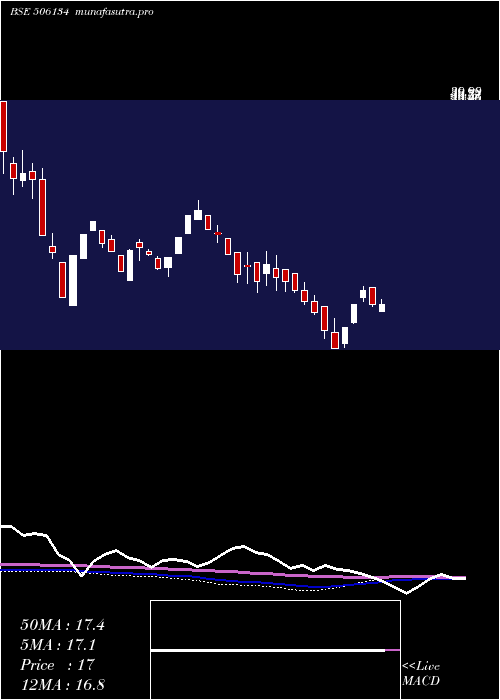
Monthly price and charts IntellCap Strong monthly Stock price targets for IntellCap 506134 are 13.13 and 15.28 | Monthly Target 1 | 12.61 | | Monthly Target 2 | 13.64 | | Monthly Target 3 | 14.763333333333 | | Monthly Target 4 | 15.79 | | Monthly Target 5 | 16.91 |
Monthly price and volumes Intell Cap
| Date |
Closing |
Open |
Range |
Volume |
Fri 05 December 2025 |
14.66 (-4.5%) |
15.35 |
13.74 - 15.89 |
0.0498 times |
Fri 28 November 2025 |
15.35 (-8.63%) |
16.38 |
14.68 - 17.00 |
0.5302 times |
Fri 31 October 2025 |
16.80 (-8.05%) |
19.17 |
14.50 - 19.17 |
0.7895 times |
Tue 30 September 2025 |
18.27 (38.94%) |
13.99 |
12.70 - 18.27 |
1.4234 times |
Fri 29 August 2025 |
13.15 (-18.53%) |
16.60 |
12.80 - 17.50 |
0.5973 times |
Thu 31 July 2025 |
16.14 (-9.68%) |
18.00 |
15.12 - 19.49 |
1.2653 times |
Mon 30 June 2025 |
17.87 (-0.72%) |
17.10 |
16.76 - 21.59 |
1.1776 times |
Fri 30 May 2025 |
18.00 (8.76%) |
16.50 |
14.33 - 19.45 |
0.7132 times |
Wed 30 April 2025 |
16.55 (38.26%) |
12.50 |
12.01 - 19.04 |
0.7081 times |
Fri 28 March 2025 |
11.97 (-35.3%) |
18.50 |
11.97 - 19.42 |
2.7455 times |
Fri 28 February 2025 |
18.50 (-5.47%) |
20.46 |
18.35 - 22.94 |
0.9817 times |

DMA SMA EMA moving averages of Intell Cap 506134
DMA (daily moving average) of Intell Cap 506134
| DMA period | DMA value | | 5 day DMA | 14.72 | | 12 day DMA | 15.17 | | 20 day DMA | 15.5 | | 35 day DMA | 15.74 | | 50 day DMA | 15.75 | | 100 day DMA | 15.45 | | 150 day DMA | 16.22 | | 200 day DMA | 16.49 | EMA (exponential moving average) of Intell Cap 506134
| EMA period | EMA current | EMA prev | EMA prev2 | | 5 day EMA | 14.71 | 14.74 | 14.97 | | 12 day EMA | 15.1 | 15.18 | 15.35 | | 20 day EMA | 15.33 | 15.4 | 15.52 | | 35 day EMA | 15.43 | 15.48 | 15.55 | | 50 day EMA | 15.49 | 15.52 | 15.57 |
SMA (simple moving average) of Intell Cap 506134
| SMA period | SMA current | SMA prev | SMA prev2 | | 5 day SMA | 14.72 | 14.86 | 15.18 | | 12 day SMA | 15.17 | 15.3 | 15.46 | | 20 day SMA | 15.5 | 15.55 | 15.65 | | 35 day SMA | 15.74 | 15.77 | 15.82 | | 50 day SMA | 15.75 | 15.73 | 15.72 | | 100 day SMA | 15.45 | 15.48 | 15.51 | | 150 day SMA | 16.22 | 16.23 | 16.25 | | 200 day SMA | 16.49 | 16.51 | 16.54 |
|
|
