GenesysInt 506109 full analysis,charts,indicators,moving averages,SMA,DMA,EMA,ADX,MACD,RSIGenesys Int 506109 WideScreen charts, DMA,SMA,EMA technical analysis, forecast prediction, by indicators ADX,MACD,RSI,CCI BSE stock exchange
Daily price and charts and targets GenesysInt Strong Daily Stock price targets for GenesysInt 506109 are 415.53 and 481.73 | Daily Target 1 | 363.18 | | Daily Target 2 | 401.67 | | Daily Target 3 | 429.38333333333 | | Daily Target 4 | 467.87 | | Daily Target 5 | 495.58 |
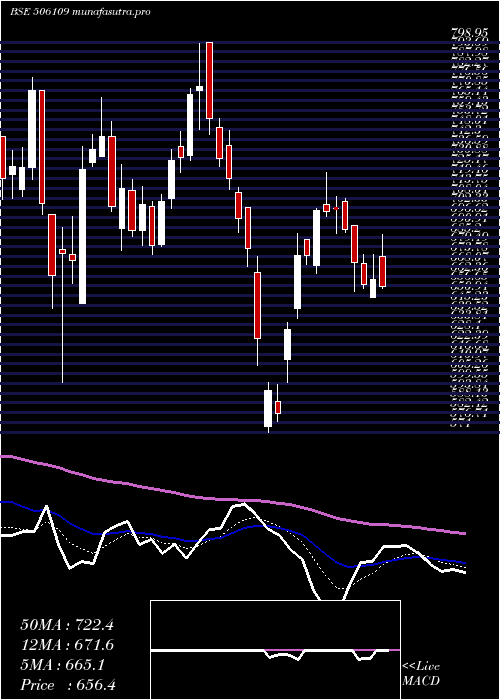
Daily price and volume Genesys Int
| Date |
Closing |
Open |
Range |
Volume |
Fri 05 December 2025 |
440.15 (10.27%) |
399.00 |
390.90 - 457.10 |
9.5767 times |
Thu 04 December 2025 |
399.15 (-3.82%) |
411.95 |
397.95 - 416.80 |
0.0487 times |
Wed 03 December 2025 |
415.00 (-0.55%) |
417.40 |
414.00 - 423.30 |
0.0216 times |
Tue 02 December 2025 |
417.30 (-2.44%) |
427.90 |
409.00 - 427.90 |
0.0705 times |
Mon 01 December 2025 |
427.75 (-0.64%) |
426.05 |
423.20 - 433.75 |
0.0157 times |
Fri 28 November 2025 |
430.50 (0.19%) |
426.75 |
424.20 - 437.15 |
0.0361 times |
Thu 27 November 2025 |
429.70 (-2.04%) |
440.60 |
428.35 - 449.00 |
0.0597 times |
Wed 26 November 2025 |
438.65 (0.23%) |
438.95 |
436.95 - 447.00 |
0.0253 times |
Tue 25 November 2025 |
437.65 (0.41%) |
436.05 |
430.35 - 441.00 |
0.062 times |
Mon 24 November 2025 |
435.85 (-6.06%) |
459.90 |
432.80 - 462.00 |
0.0837 times |
Fri 21 November 2025 |
463.95 (-2.79%) |
469.90 |
460.85 - 471.20 |
0.0345 times |
Weekly price and charts GenesysInt Strong weekly Stock price targets for GenesysInt 506109 are 415.53 and 481.73 | Weekly Target 1 | 363.18 | | Weekly Target 2 | 401.67 | | Weekly Target 3 | 429.38333333333 | | Weekly Target 4 | 467.87 | | Weekly Target 5 | 495.58 |
Weekly price and volumes for Genesys Int
| Date |
Closing |
Open |
Range |
Volume |
Fri 05 December 2025 |
440.15 (2.24%) |
426.05 |
390.90 - 457.10 |
4.996 times |
Fri 28 November 2025 |
430.50 (-7.21%) |
459.90 |
424.20 - 462.00 |
0.1369 times |
Fri 21 November 2025 |
463.95 (-2.59%) |
473.00 |
430.70 - 491.95 |
0.1917 times |
Fri 14 November 2025 |
476.30 (-0.62%) |
475.35 |
470.05 - 512.95 |
0.1785 times |
Fri 07 November 2025 |
479.25 (-5.66%) |
505.35 |
476.55 - 515.20 |
0.1052 times |
Fri 31 October 2025 |
508.00 (-5.22%) |
520.90 |
496.75 - 527.25 |
0.1816 times |
Thu 23 October 2025 |
536.00 (-7.19%) |
599.80 |
532.90 - 599.80 |
0.2319 times |
Fri 17 October 2025 |
577.55 (19.25%) |
482.75 |
465.00 - 613.15 |
3.5164 times |
Fri 10 October 2025 |
484.30 (-2.66%) |
490.35 |
472.55 - 500.05 |
0.1984 times |
Fri 03 October 2025 |
497.55 (-1.85%) |
512.40 |
455.20 - 526.10 |
0.2633 times |
Fri 26 September 2025 |
506.95 (-9.54%) |
557.05 |
505.00 - 559.00 |
0.2297 times |

Monthly price and charts GenesysInt Strong monthly Stock price targets for GenesysInt 506109 are 415.53 and 481.73 | Monthly Target 1 | 363.18 | | Monthly Target 2 | 401.67 | | Monthly Target 3 | 429.38333333333 | | Monthly Target 4 | 467.87 | | Monthly Target 5 | 495.58 |
Monthly price and volumes Genesys Int
| Date |
Closing |
Open |
Range |
Volume |
Fri 05 December 2025 |
440.15 (2.24%) |
426.05 |
390.90 - 457.10 |
2.9833 times |
Fri 28 November 2025 |
430.50 (-15.26%) |
505.35 |
424.20 - 515.20 |
0.3657 times |
Fri 31 October 2025 |
508.00 (1.68%) |
505.75 |
465.00 - 613.15 |
2.5255 times |
Tue 30 September 2025 |
499.60 (-11.2%) |
573.00 |
455.20 - 647.55 |
0.6387 times |
Fri 29 August 2025 |
562.60 (-6.23%) |
597.00 |
555.00 - 619.05 |
0.4461 times |
Thu 31 July 2025 |
599.95 (-6.75%) |
640.25 |
577.65 - 672.85 |
0.6642 times |
Mon 30 June 2025 |
643.40 (-13.41%) |
744.75 |
625.60 - 750.55 |
0.5745 times |
Fri 30 May 2025 |
743.05 (13.21%) |
656.35 |
621.00 - 757.00 |
0.4934 times |
Wed 30 April 2025 |
656.35 (-8.76%) |
711.20 |
571.00 - 723.10 |
0.4901 times |
Fri 28 March 2025 |
719.35 (8.55%) |
678.00 |
600.00 - 798.95 |
0.8185 times |
Fri 28 February 2025 |
662.70 (-19.7%) |
908.95 |
643.15 - 908.95 |
1.3048 times |

DMA SMA EMA moving averages of Genesys Int 506109
DMA (daily moving average) of Genesys Int 506109
| DMA period | DMA value | | 5 day DMA | 419.87 | | 12 day DMA | 434.41 | | 20 day DMA | 449.25 | | 35 day DMA | 482.88 | | 50 day DMA | 488.51 | | 100 day DMA | 544.34 | | 150 day DMA | 589.09 | | 200 day DMA | 622.81 | EMA (exponential moving average) of Genesys Int 506109
| EMA period | EMA current | EMA prev | EMA prev2 | | 5 day EMA | 423.84 | 415.68 | 423.95 | | 12 day EMA | 434.12 | 433.02 | 439.18 | | 20 day EMA | 448.17 | 449.01 | 454.26 | | 35 day EMA | 467.58 | 469.2 | 473.32 | | 50 day EMA | 488.36 | 490.33 | 494.05 |
SMA (simple moving average) of Genesys Int 506109
| SMA period | SMA current | SMA prev | SMA prev2 | | 5 day SMA | 419.87 | 417.94 | 424.05 | | 12 day SMA | 434.41 | 433.83 | 438.15 | | 20 day SMA | 449.25 | 451.39 | 456.56 | | 35 day SMA | 482.88 | 483.66 | 486.09 | | 50 day SMA | 488.51 | 490.91 | 494.48 | | 100 day SMA | 544.34 | 546.22 | 548.46 | | 150 day SMA | 589.09 | 590.53 | 592.34 | | 200 day SMA | 622.81 | 624.84 | 626.97 |
|
|
