Mancredit 505850 full analysis,charts,indicators,moving averages,SMA,DMA,EMA,ADX,MACD,RSIMancredit 505850 WideScreen charts, DMA,SMA,EMA technical analysis, forecast prediction, by indicators ADX,MACD,RSI,CCI BSE stock exchange
Daily price and charts and targets Mancredit Strong Daily Stock price targets for Mancredit 505850 are 168.25 and 182.85 | Daily Target 1 | 157.57 | | Daily Target 2 | 164.33 | | Daily Target 3 | 172.16666666667 | | Daily Target 4 | 178.93 | | Daily Target 5 | 186.77 |
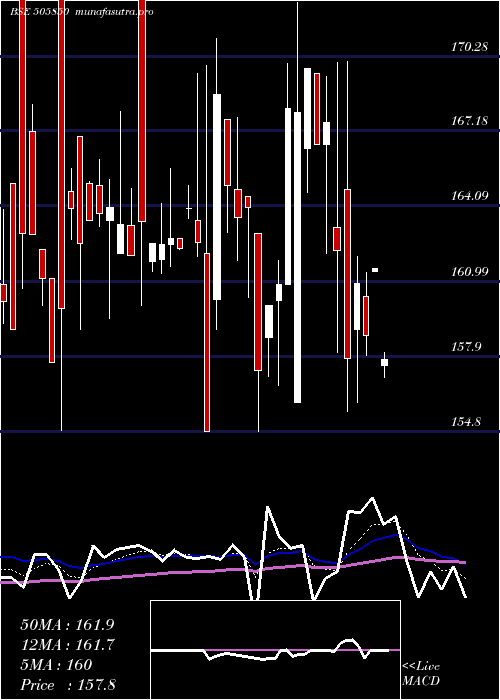
Daily price and volume Mancredit
| Date |
Closing |
Open |
Range |
Volume |
Fri 05 December 2025 |
171.10 (2.64%) |
168.25 |
165.40 - 180.00 |
2.001 times |
Thu 04 December 2025 |
166.70 (-2.29%) |
170.45 |
166.40 - 174.10 |
1.3413 times |
Wed 03 December 2025 |
170.60 (-0.87%) |
172.95 |
169.30 - 172.95 |
0.7503 times |
Tue 02 December 2025 |
172.10 (0.41%) |
174.30 |
172.10 - 174.30 |
0.7103 times |
Mon 01 December 2025 |
171.40 (-2.14%) |
174.65 |
171.40 - 183.00 |
1.3952 times |
Fri 28 November 2025 |
175.15 (1.42%) |
172.85 |
170.05 - 175.15 |
0.7093 times |
Thu 27 November 2025 |
172.70 (0.26%) |
173.95 |
170.95 - 178.00 |
0.8854 times |
Wed 26 November 2025 |
172.25 (-2.21%) |
175.05 |
172.25 - 177.05 |
0.7703 times |
Tue 25 November 2025 |
176.15 (0.31%) |
174.90 |
173.65 - 176.30 |
0.7342 times |
Mon 24 November 2025 |
175.60 (0.17%) |
175.35 |
175.15 - 176.25 |
0.7026 times |
Fri 21 November 2025 |
175.30 (2.25%) |
175.75 |
171.90 - 182.00 |
2.4236 times |
Weekly price and charts Mancredit Strong weekly Stock price targets for Mancredit 505850 are 159.45 and 177.05 | Weekly Target 1 | 155.57 | | Weekly Target 2 | 163.33 | | Weekly Target 3 | 173.16666666667 | | Weekly Target 4 | 180.93 | | Weekly Target 5 | 190.77 |
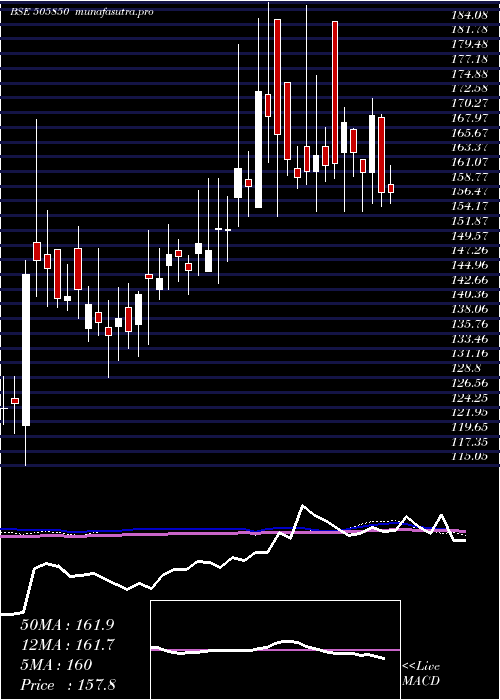
Weekly price and volumes for Mancredit
| Date |
Closing |
Open |
Range |
Volume |
Fri 05 December 2025 |
171.10 (-2.31%) |
174.65 |
165.40 - 183.00 |
1.2561 times |
Fri 28 November 2025 |
175.15 (-0.09%) |
175.35 |
170.05 - 178.00 |
0.7705 times |
Fri 21 November 2025 |
175.30 (-1.1%) |
179.05 |
170.85 - 182.00 |
1.2698 times |
Fri 14 November 2025 |
177.25 (-2.37%) |
183.45 |
177.00 - 183.45 |
0.9229 times |
Fri 07 November 2025 |
181.55 (-0.9%) |
183.55 |
175.45 - 186.95 |
0.7925 times |
Fri 31 October 2025 |
183.20 (1.81%) |
182.00 |
178.10 - 188.35 |
1.4743 times |
Thu 23 October 2025 |
179.95 (-0.28%) |
180.15 |
176.00 - 184.45 |
0.6287 times |
Fri 17 October 2025 |
180.45 (0.03%) |
177.70 |
176.00 - 187.10 |
1.1904 times |
Fri 10 October 2025 |
180.40 (-1.61%) |
184.30 |
180.05 - 190.00 |
0.9172 times |
Fri 03 October 2025 |
183.35 (-1.77%) |
186.30 |
181.00 - 191.00 |
0.7776 times |
Fri 26 September 2025 |
186.65 (-0.9%) |
187.90 |
184.90 - 197.90 |
1.0858 times |
Monthly price and charts Mancredit Strong monthly Stock price targets for Mancredit 505850 are 159.45 and 177.05 | Monthly Target 1 | 155.57 | | Monthly Target 2 | 163.33 | | Monthly Target 3 | 173.16666666667 | | Monthly Target 4 | 180.93 | | Monthly Target 5 | 190.77 |
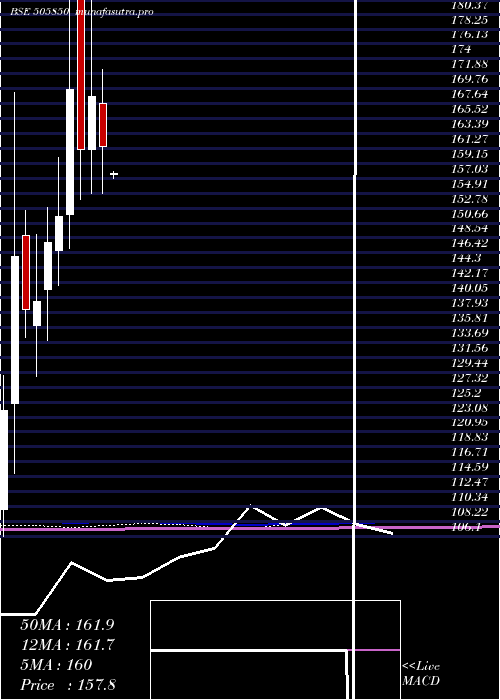
Monthly price and volumes Mancredit
| Date |
Closing |
Open |
Range |
Volume |
Fri 05 December 2025 |
171.10 (-2.31%) |
174.65 |
165.40 - 183.00 |
0.312 times |
Fri 28 November 2025 |
175.15 (-4.39%) |
183.55 |
170.05 - 186.95 |
0.933 times |
Fri 31 October 2025 |
183.20 (1.22%) |
182.90 |
176.00 - 191.00 |
1.15 times |
Tue 30 September 2025 |
181.00 (-0.06%) |
180.50 |
180.10 - 197.90 |
1.1622 times |
Fri 29 August 2025 |
181.10 (-1.71%) |
187.10 |
173.45 - 193.60 |
1.1275 times |
Thu 31 July 2025 |
184.25 (-5.2%) |
194.30 |
183.25 - 208.90 |
1.6346 times |
Mon 30 June 2025 |
194.35 (-0.74%) |
190.05 |
176.00 - 219.30 |
1.9488 times |
Fri 30 May 2025 |
195.80 (21.24%) |
157.50 |
150.00 - 200.10 |
1.0312 times |
Wed 30 April 2025 |
161.50 (-4.27%) |
167.65 |
154.80 - 172.50 |
0.3253 times |
Fri 28 March 2025 |
168.70 (4.72%) |
161.10 |
154.80 - 184.45 |
0.3754 times |
Fri 28 February 2025 |
161.10 (-5.04%) |
184.80 |
154.00 - 187.00 |
0.6275 times |
DMA SMA EMA moving averages of Mancredit 505850
DMA (daily moving average) of Mancredit 505850
| DMA period | DMA value | | 5 day DMA | 170.38 | | 12 day DMA | 172.54 | | 20 day DMA | 175.18 | | 35 day DMA | 177.92 | | 50 day DMA | 179.82 | | 100 day DMA | 183.3 | | 150 day DMA | 183.12 | | 200 day DMA | 178.11 | EMA (exponential moving average) of Mancredit 505850
| EMA period | EMA current | EMA prev | EMA prev2 | | 5 day EMA | 170.6 | 170.35 | 172.17 | | 12 day EMA | 172.62 | 172.9 | 174.03 | | 20 day EMA | 174.54 | 174.9 | 175.76 | | 35 day EMA | 177.16 | 177.52 | 178.16 | | 50 day EMA | 179.67 | 180.02 | 180.56 |
SMA (simple moving average) of Mancredit 505850
| SMA period | SMA current | SMA prev | SMA prev2 | | 5 day SMA | 170.38 | 171.19 | 172.39 | | 12 day SMA | 172.54 | 173.07 | 173.84 | | 20 day SMA | 175.18 | 175.57 | 176.5 | | 35 day SMA | 177.92 | 178.19 | 178.58 | | 50 day SMA | 179.82 | 180.17 | 180.71 | | 100 day SMA | 183.3 | 183.53 | 183.81 | | 150 day SMA | 183.12 | 183.05 | 182.99 | | 200 day SMA | 178.11 | 178.04 | 178.06 |
|
|
