GabrielI 505714 full analysis,charts,indicators,moving averages,SMA,DMA,EMA,ADX,MACD,RSIGabriel I 505714 WideScreen charts, DMA,SMA,EMA technical analysis, forecast prediction, by indicators ADX,MACD,RSI,CCI BSE stock exchange
Daily price and charts and targets GabrielI Strong Daily Stock price targets for GabrielI 505714 are 1252.75 and 1290.9 | Daily Target 1 | 1242.12 | | Daily Target 2 | 1263.38 | | Daily Target 3 | 1280.2666666667 | | Daily Target 4 | 1301.53 | | Daily Target 5 | 1318.42 |
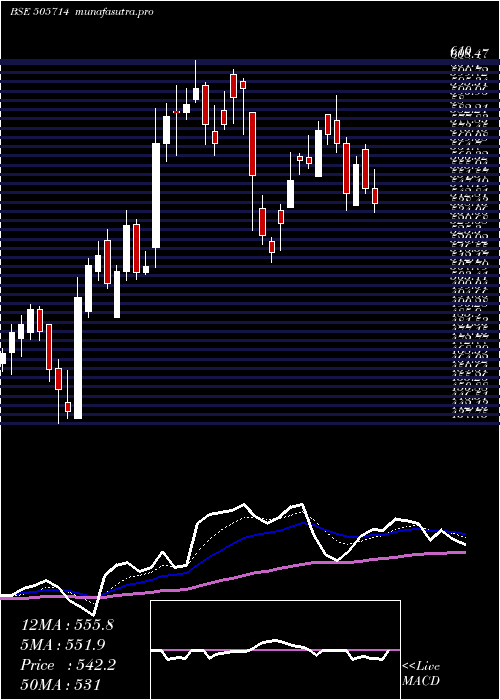
Daily price and volume Gabriel I
| Date |
Closing |
Open |
Range |
Volume |
Tue 21 October 2025 |
1284.65 (-0.63%) |
1287.50 |
1259.00 - 1297.15 |
0.1974 times |
Mon 20 October 2025 |
1292.85 (4.62%) |
1260.70 |
1235.75 - 1300.00 |
1.7493 times |
Fri 17 October 2025 |
1235.75 (-2.44%) |
1288.70 |
1226.10 - 1293.55 |
0.9423 times |
Thu 16 October 2025 |
1266.65 (-2.12%) |
1294.15 |
1248.00 - 1294.15 |
1.1008 times |
Wed 15 October 2025 |
1294.05 (6.1%) |
1219.95 |
1219.95 - 1300.20 |
1.087 times |
Tue 14 October 2025 |
1219.60 (-2.39%) |
1273.50 |
1209.75 - 1273.50 |
1.0072 times |
Mon 13 October 2025 |
1249.50 (-1.54%) |
1243.65 |
1242.55 - 1281.50 |
0.5945 times |
Fri 10 October 2025 |
1269.00 (-1.75%) |
1291.75 |
1265.00 - 1301.10 |
1.0188 times |
Thu 09 October 2025 |
1291.55 (-1.7%) |
1316.00 |
1283.15 - 1336.40 |
0.4589 times |
Wed 08 October 2025 |
1313.90 (0.16%) |
1319.80 |
1305.95 - 1386.45 |
1.8438 times |
Tue 07 October 2025 |
1311.85 (2.66%) |
1294.90 |
1265.85 - 1345.95 |
1.1013 times |
Weekly price and charts GabrielI Strong weekly Stock price targets for GabrielI 505714 are 1260.2 and 1324.45 | Weekly Target 1 | 1209.22 | | Weekly Target 2 | 1246.93 | | Weekly Target 3 | 1273.4666666667 | | Weekly Target 4 | 1311.18 | | Weekly Target 5 | 1337.72 |
Weekly price and volumes for Gabriel I
| Date |
Closing |
Open |
Range |
Volume |
Tue 21 October 2025 |
1284.65 (3.96%) |
1260.70 |
1235.75 - 1300.00 |
0.2344 times |
Fri 17 October 2025 |
1235.75 (-2.62%) |
1243.65 |
1209.75 - 1300.20 |
0.5696 times |
Fri 10 October 2025 |
1269.00 (-1.7%) |
1294.95 |
1264.00 - 1386.45 |
0.6271 times |
Fri 03 October 2025 |
1291.00 (4.17%) |
1175.60 |
1168.00 - 1299.00 |
0.4726 times |
Fri 26 September 2025 |
1239.35 (-3.59%) |
1290.30 |
1227.80 - 1318.00 |
0.6279 times |
Fri 19 September 2025 |
1285.55 (4.61%) |
1257.85 |
1218.00 - 1331.50 |
1.6526 times |
Fri 12 September 2025 |
1228.95 (2.29%) |
1247.80 |
1209.45 - 1284.00 |
0.8335 times |
Fri 05 September 2025 |
1201.40 (4.27%) |
1150.85 |
1148.35 - 1287.00 |
1.3215 times |
Fri 29 August 2025 |
1152.25 (-3.27%) |
1195.90 |
1111.15 - 1196.70 |
2.1571 times |
Fri 22 August 2025 |
1191.25 (10.73%) |
1075.45 |
1075.45 - 1205.20 |
1.5038 times |
Thu 14 August 2025 |
1075.80 (6.58%) |
1003.15 |
996.00 - 1118.95 |
1.0213 times |

Monthly price and charts GabrielI Strong monthly Stock price targets for GabrielI 505714 are 1237.25 and 1433.85 | Monthly Target 1 | 1090.38 | | Monthly Target 2 | 1187.52 | | Monthly Target 3 | 1286.9833333333 | | Monthly Target 4 | 1384.12 | | Monthly Target 5 | 1483.58 |
Monthly price and volumes Gabriel I
| Date |
Closing |
Open |
Range |
Volume |
Tue 21 October 2025 |
1284.65 (8.91%) |
1189.95 |
1189.85 - 1386.45 |
0.3606 times |
Tue 30 September 2025 |
1179.55 (2.37%) |
1150.85 |
1148.35 - 1331.50 |
1.0385 times |
Fri 29 August 2025 |
1152.25 (10.96%) |
1026.20 |
989.05 - 1205.20 |
1.2048 times |
Thu 31 July 2025 |
1038.45 (47.83%) |
842.90 |
842.90 - 1122.25 |
2.4483 times |
Mon 30 June 2025 |
702.45 (6.72%) |
669.65 |
581.70 - 706.50 |
0.6917 times |
Fri 30 May 2025 |
658.20 (21.41%) |
527.05 |
527.05 - 690.00 |
1.0248 times |
Wed 30 April 2025 |
542.15 (-6.42%) |
602.95 |
514.25 - 605.55 |
0.5739 times |
Fri 28 March 2025 |
579.35 (24.99%) |
463.90 |
437.75 - 610.00 |
1.5528 times |
Fri 28 February 2025 |
463.50 (0.39%) |
441.40 |
435.60 - 519.95 |
0.6283 times |
Fri 31 January 2025 |
461.70 (-2.56%) |
482.00 |
387.05 - 509.95 |
0.4764 times |
Tue 31 December 2024 |
473.85 (6.92%) |
439.05 |
428.00 - 539.00 |
1.0056 times |

DMA SMA EMA moving averages of Gabriel I 505714
DMA (daily moving average) of Gabriel I 505714
| DMA period | DMA value | | 5 day DMA | 1274.79 | | 12 day DMA | 1275.6 | | 20 day DMA | 1264.64 | | 35 day DMA | 1262 | | 50 day DMA | 1222.1 | | 100 day DMA | 1032.77 | | 150 day DMA | 880.38 | | 200 day DMA | 776.56 | EMA (exponential moving average) of Gabriel I 505714
| EMA period | EMA current | EMA prev | EMA prev2 | | 5 day EMA | 1274.08 | 1268.8 | 1256.78 | | 12 day EMA | 1269.54 | 1266.79 | 1262.05 | | 20 day EMA | 1262.96 | 1260.68 | 1257.29 | | 35 day EMA | 1235.18 | 1232.27 | 1228.7 | | 50 day EMA | 1210.09 | 1207.05 | 1203.55 |
SMA (simple moving average) of Gabriel I 505714
| SMA period | SMA current | SMA prev | SMA prev2 | | 5 day SMA | 1274.79 | 1261.78 | 1253.11 | | 12 day SMA | 1275.6 | 1276.13 | 1271.59 | | 20 day SMA | 1264.64 | 1264.66 | 1264.29 | | 35 day SMA | 1262 | 1260.47 | 1256.45 | | 50 day SMA | 1222.1 | 1216.67 | 1210.98 | | 100 day SMA | 1032.77 | 1026.41 | 1019.98 | | 150 day SMA | 880.38 | 875.13 | 869.47 | | 200 day SMA | 776.56 | 772.56 | 768.54 |
|
|
