WendtIndia 505412 full analysis,charts,indicators,moving averages,SMA,DMA,EMA,ADX,MACD,RSIWendt India 505412 WideScreen charts, DMA,SMA,EMA technical analysis, forecast prediction, by indicators ADX,MACD,RSI,CCI BSE stock exchange
Daily price and charts and targets WendtIndia Strong Daily Stock price targets for WendtIndia 505412 are 9102.78 and 9297.68 | Daily Target 1 | 8963.62 | | Daily Target 2 | 9047.03 | | Daily Target 3 | 9158.5166666667 | | Daily Target 4 | 9241.93 | | Daily Target 5 | 9353.42 |
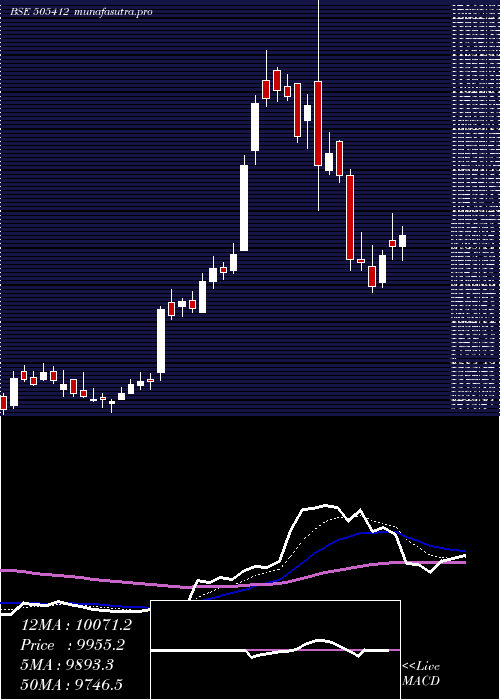
Daily price and volume Wendt India
| Date |
Closing |
Open |
Range |
Volume |
Tue 21 October 2025 |
9130.45 (1.96%) |
9078.90 |
9075.10 - 9270.00 |
0.5665 times |
Mon 20 October 2025 |
8954.95 (3.21%) |
8677.00 |
8510.75 - 9049.00 |
1.865 times |
Fri 17 October 2025 |
8676.65 (-1.98%) |
8887.50 |
8550.00 - 9001.95 |
3.7198 times |
Thu 16 October 2025 |
8852.10 (0.86%) |
8789.00 |
8775.00 - 8875.35 |
0.3497 times |
Wed 15 October 2025 |
8776.80 (0.37%) |
8750.00 |
8733.55 - 8863.65 |
0.7137 times |
Tue 14 October 2025 |
8744.75 (-1.12%) |
8855.00 |
8700.00 - 8879.95 |
0.5358 times |
Mon 13 October 2025 |
8843.70 (-0.68%) |
8948.90 |
8821.00 - 8948.90 |
0.1616 times |
Fri 10 October 2025 |
8904.40 (0.79%) |
8840.50 |
8840.50 - 8999.00 |
0.4928 times |
Thu 09 October 2025 |
8834.55 (-0.88%) |
8913.25 |
8800.00 - 8916.55 |
1.1411 times |
Wed 08 October 2025 |
8913.25 (-0.71%) |
8960.45 |
8875.50 - 8991.75 |
0.454 times |
Tue 07 October 2025 |
8977.15 (-0.34%) |
9099.90 |
8932.50 - 9099.90 |
0.8323 times |
Weekly price and charts WendtIndia Strong weekly Stock price targets for WendtIndia 505412 are 8820.6 and 9579.85 | Weekly Target 1 | 8211.15 | | Weekly Target 2 | 8670.8 | | Weekly Target 3 | 8970.4 | | Weekly Target 4 | 9430.05 | | Weekly Target 5 | 9729.65 |
Weekly price and volumes for Wendt India
| Date |
Closing |
Open |
Range |
Volume |
Tue 21 October 2025 |
9130.45 (5.23%) |
8677.00 |
8510.75 - 9270.00 |
0.3157 times |
Fri 17 October 2025 |
8676.65 (-2.56%) |
8948.90 |
8550.00 - 9001.95 |
0.7117 times |
Fri 10 October 2025 |
8904.40 (-2.54%) |
9124.10 |
8800.00 - 9136.50 |
0.4894 times |
Fri 03 October 2025 |
9136.50 (3.19%) |
8855.00 |
8747.00 - 9270.00 |
1.0075 times |
Fri 26 September 2025 |
8854.35 (-7.84%) |
9590.00 |
8801.00 - 9620.20 |
0.9918 times |
Fri 19 September 2025 |
9607.40 (-0.35%) |
9625.05 |
9549.45 - 9847.40 |
0.9127 times |
Fri 12 September 2025 |
9640.75 (-2.29%) |
9950.00 |
9573.25 - 10023.20 |
0.9345 times |
Fri 05 September 2025 |
9867.15 (0.47%) |
9850.05 |
9769.85 - 10325.00 |
1.7258 times |
Fri 29 August 2025 |
9820.55 (-2.9%) |
10113.60 |
9779.00 - 10210.90 |
0.8838 times |
Fri 22 August 2025 |
10113.45 (2.73%) |
10189.95 |
9883.50 - 10587.25 |
2.027 times |
Thu 14 August 2025 |
9844.55 (0.86%) |
9610.20 |
9524.65 - 10199.00 |
1.6584 times |

Monthly price and charts WendtIndia Strong monthly Stock price targets for WendtIndia 505412 are 8820.6 and 9579.85 | Monthly Target 1 | 8211.15 | | Monthly Target 2 | 8670.8 | | Monthly Target 3 | 8970.4 | | Monthly Target 4 | 9430.05 | | Monthly Target 5 | 9729.65 |
Monthly price and volumes Wendt India
| Date |
Closing |
Open |
Range |
Volume |
Tue 21 October 2025 |
9130.45 (3.97%) |
8845.00 |
8510.75 - 9270.00 |
0.2856 times |
Tue 30 September 2025 |
8781.55 (-10.58%) |
9850.05 |
8747.00 - 10325.00 |
0.7685 times |
Fri 29 August 2025 |
9820.55 (-1.35%) |
9955.15 |
9521.00 - 10587.25 |
0.9908 times |
Thu 31 July 2025 |
9955.15 (8.05%) |
9288.95 |
9118.95 - 13000.00 |
3.9471 times |
Mon 30 June 2025 |
9213.85 (8.38%) |
8505.00 |
8174.40 - 9245.95 |
1.4756 times |
Fri 30 May 2025 |
8501.45 (-13.65%) |
9972.05 |
8320.00 - 10587.00 |
2.2653 times |
Wed 30 April 2025 |
9845.65 (10.45%) |
8914.30 |
8914.30 - 11500.00 |
0.0641 times |
Fri 28 March 2025 |
8914.30 (-7.02%) |
9500.00 |
8400.00 - 10464.45 |
0.1404 times |
Fri 28 February 2025 |
9586.85 (-20.55%) |
12396.75 |
9495.80 - 12500.00 |
0.0284 times |
Fri 31 January 2025 |
12066.65 (-26.79%) |
16500.00 |
11507.00 - 17400.00 |
0.0342 times |
Tue 31 December 2024 |
16482.00 (4.3%) |
16298.95 |
15510.05 - 18000.00 |
0.0332 times |

DMA SMA EMA moving averages of Wendt India 505412
DMA (daily moving average) of Wendt India 505412
| DMA period | DMA value | | 5 day DMA | 8878.19 | | 12 day DMA | 8884.68 | | 20 day DMA | 8950.16 | | 35 day DMA | 9302.32 | | 50 day DMA | 9493.31 | | 100 day DMA | 9447.75 | | 150 day DMA | 9496.44 | | 200 day DMA | 10410.35 | EMA (exponential moving average) of Wendt India 505412
| EMA period | EMA current | EMA prev | EMA prev2 | | 5 day EMA | 8935.71 | 8838.36 | 8780.07 | | 12 day EMA | 8931.94 | 8895.86 | 8885.12 | | 20 day EMA | 9025.65 | 9014.62 | 9020.9 | | 35 day EMA | 9220.02 | 9225.29 | 9241.21 | | 50 day EMA | 9461.54 | 9475.05 | 9496.27 |
SMA (simple moving average) of Wendt India 505412
| SMA period | SMA current | SMA prev | SMA prev2 | | 5 day SMA | 8878.19 | 8801.05 | 8778.8 | | 12 day SMA | 8884.68 | 8885.18 | 8879.55 | | 20 day SMA | 8950.16 | 8966.36 | 8998.98 | | 35 day SMA | 9302.32 | 9323.01 | 9347.74 | | 50 day SMA | 9493.31 | 9506.66 | 9521.16 | | 100 day SMA | 9447.75 | 9441.06 | 9436.57 | | 150 day SMA | 9496.44 | 9492.39 | 9488.97 | | 200 day SMA | 10410.35 | 10446.19 | 10486.37 |
|
|
