Mirch 505336 full analysis,charts,indicators,moving averages,SMA,DMA,EMA,ADX,MACD,RSIMirch 505336 WideScreen charts, DMA,SMA,EMA technical analysis, forecast prediction, by indicators ADX,MACD,RSI,CCI BSE stock exchange
Daily price and charts and targets Mirch Strong Daily Stock price targets for Mirch 505336 are 0.5 and 0.52 | Daily Target 1 | 0.48 | | Daily Target 2 | 0.5 | | Daily Target 3 | 0.50333333333333 | | Daily Target 4 | 0.52 | | Daily Target 5 | 0.52 |
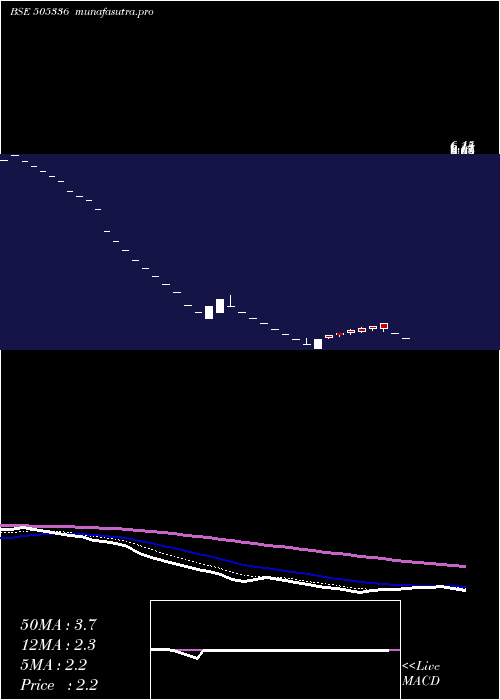
Daily price and volume Mirch
| Date |
Closing |
Open |
Range |
Volume |
Fri 05 December 2025 |
0.51 (2%) |
0.50 |
0.49 - 0.51 |
0.535 times |
Thu 04 December 2025 |
0.50 (0%) |
0.49 |
0.49 - 0.51 |
0.9399 times |
Wed 03 December 2025 |
0.50 (-1.96%) |
0.51 |
0.49 - 0.52 |
1.3129 times |
Tue 02 December 2025 |
0.51 (0%) |
0.51 |
0.50 - 0.52 |
0.8396 times |
Mon 01 December 2025 |
0.51 (-1.92%) |
0.52 |
0.51 - 0.53 |
0.5736 times |
Fri 28 November 2025 |
0.52 (1.96%) |
0.51 |
0.50 - 0.52 |
0.7315 times |
Thu 27 November 2025 |
0.51 (0%) |
0.51 |
0.50 - 0.52 |
0.9823 times |
Wed 26 November 2025 |
0.51 (0%) |
0.52 |
0.50 - 0.53 |
2.0339 times |
Tue 25 November 2025 |
0.51 (-3.77%) |
0.52 |
0.51 - 0.53 |
1.0684 times |
Mon 24 November 2025 |
0.53 (-1.85%) |
0.54 |
0.53 - 0.55 |
0.983 times |
Fri 21 November 2025 |
0.54 (-1.82%) |
0.55 |
0.54 - 0.56 |
0.6536 times |
Weekly price and charts Mirch Strong weekly Stock price targets for Mirch 505336 are 0.48 and 0.52 | Weekly Target 1 | 0.47 | | Weekly Target 2 | 0.49 | | Weekly Target 3 | 0.51 | | Weekly Target 4 | 0.53 | | Weekly Target 5 | 0.55 |
Weekly price and volumes for Mirch
| Date |
Closing |
Open |
Range |
Volume |
Fri 05 December 2025 |
0.51 (-1.92%) |
0.52 |
0.49 - 0.53 |
0.3009 times |
Fri 28 November 2025 |
0.52 (-3.7%) |
0.54 |
0.50 - 0.55 |
0.4154 times |
Fri 21 November 2025 |
0.54 (-11.48%) |
0.59 |
0.54 - 0.59 |
0.2823 times |
Fri 14 November 2025 |
0.61 (3.39%) |
0.60 |
0.58 - 0.65 |
0.4852 times |
Fri 07 November 2025 |
0.59 (-4.84%) |
0.62 |
0.57 - 0.64 |
0.4119 times |
Fri 31 October 2025 |
0.62 (-6.06%) |
0.60 |
0.57 - 0.68 |
1.3104 times |
Thu 23 October 2025 |
0.66 (4.76%) |
0.65 |
0.65 - 0.72 |
0.5474 times |
Fri 17 October 2025 |
0.63 (21.15%) |
0.54 |
0.54 - 0.63 |
0.706 times |
Fri 10 October 2025 |
0.52 (-27.78%) |
0.69 |
0.52 - 0.70 |
1.7058 times |
Fri 03 October 2025 |
0.72 (-16.28%) |
0.90 |
0.72 - 0.90 |
3.8347 times |
Fri 26 September 2025 |
0.86 (-12.24%) |
0.94 |
0.82 - 0.98 |
1.9143 times |

Monthly price and charts Mirch Strong monthly Stock price targets for Mirch 505336 are 0.48 and 0.52 | Monthly Target 1 | 0.47 | | Monthly Target 2 | 0.49 | | Monthly Target 3 | 0.51 | | Monthly Target 4 | 0.53 | | Monthly Target 5 | 0.55 |
Monthly price and volumes Mirch
| Date |
Closing |
Open |
Range |
Volume |
Fri 05 December 2025 |
0.51 (-1.92%) |
0.52 |
0.49 - 0.53 |
0.1165 times |
Fri 28 November 2025 |
0.52 (-16.13%) |
0.62 |
0.50 - 0.65 |
0.6176 times |
Fri 31 October 2025 |
0.62 (-20.51%) |
0.77 |
0.52 - 0.81 |
2.1551 times |
Tue 30 September 2025 |
0.78 (-43.48%) |
1.44 |
0.78 - 1.65 |
3.6571 times |
Fri 29 August 2025 |
1.38 (4.55%) |
1.30 |
1.15 - 1.45 |
0.5767 times |
Thu 31 July 2025 |
1.32 (-16.98%) |
1.62 |
1.26 - 1.62 |
0.0879 times |
Mon 30 June 2025 |
1.59 (-5.92%) |
1.61 |
1.29 - 1.94 |
0.3821 times |
Fri 30 May 2025 |
1.69 (-40.7%) |
2.71 |
1.69 - 2.71 |
1.6468 times |
Wed 30 April 2025 |
2.85 (-46.83%) |
5.26 |
2.59 - 5.26 |
0.6591 times |
Fri 28 March 2025 |
5.36 (9.16%) |
5.00 |
5.00 - 6.15 |
0.101 times |
Fri 28 February 2025 |
4.91 (-0.61%) |
4.76 |
3.67 - 4.91 |
0.1065 times |
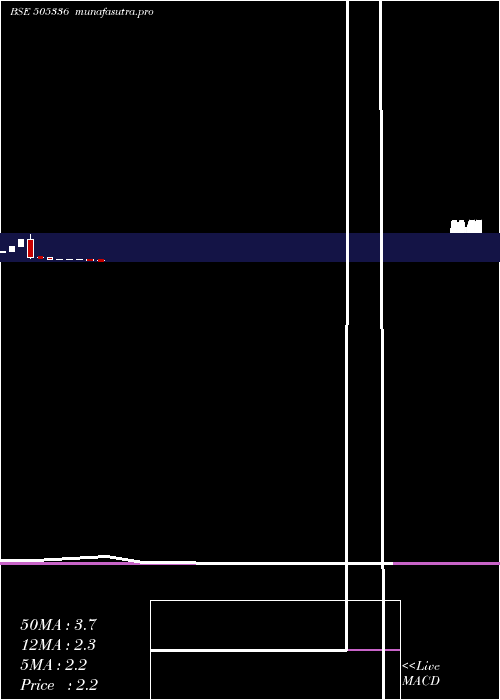
DMA SMA EMA moving averages of Mirch 505336
DMA (daily moving average) of Mirch 505336
| DMA period | DMA value | | 5 day DMA | 0.51 | | 12 day DMA | 0.52 | | 20 day DMA | 0.55 | | 35 day DMA | 0.58 | | 50 day DMA | 0.63 | | 100 day DMA | 0.97 | | 150 day DMA | 1.27 | | 200 day DMA | 2.11 | EMA (exponential moving average) of Mirch 505336
| EMA period | EMA current | EMA prev | EMA prev2 | | 5 day EMA | 0.51 | 0.51 | 0.51 | | 12 day EMA | 0.53 | 0.53 | 0.53 | | 20 day EMA | 0.55 | 0.55 | 0.55 | | 35 day EMA | 0.58 | 0.58 | 0.58 | | 50 day EMA | 0.63 | 0.64 | 0.65 |
SMA (simple moving average) of Mirch 505336
| SMA period | SMA current | SMA prev | SMA prev2 | | 5 day SMA | 0.51 | 0.51 | 0.51 | | 12 day SMA | 0.52 | 0.52 | 0.53 | | 20 day SMA | 0.55 | 0.55 | 0.56 | | 35 day SMA | 0.58 | 0.58 | 0.58 | | 50 day SMA | 0.63 | 0.64 | 0.65 | | 100 day SMA | 0.97 | 0.97 | 0.98 | | 150 day SMA | 1.27 | 1.28 | 1.3 | | 200 day SMA | 2.11 | 2.13 | 2.15 |
|
|
