DynamatTech 505242 full analysis,charts,indicators,moving averages,SMA,DMA,EMA,ADX,MACD,RSIDynamat Tech 505242 WideScreen charts, DMA,SMA,EMA technical analysis, forecast prediction, by indicators ADX,MACD,RSI,CCI BSE stock exchange
Daily price and charts and targets DynamatTech Strong Daily Stock price targets for DynamatTech 505242 are 7773.98 and 8149.48 | Daily Target 1 | 7698.65 | | Daily Target 2 | 7849.3 | | Daily Target 3 | 8074.15 | | Daily Target 4 | 8224.8 | | Daily Target 5 | 8449.65 |
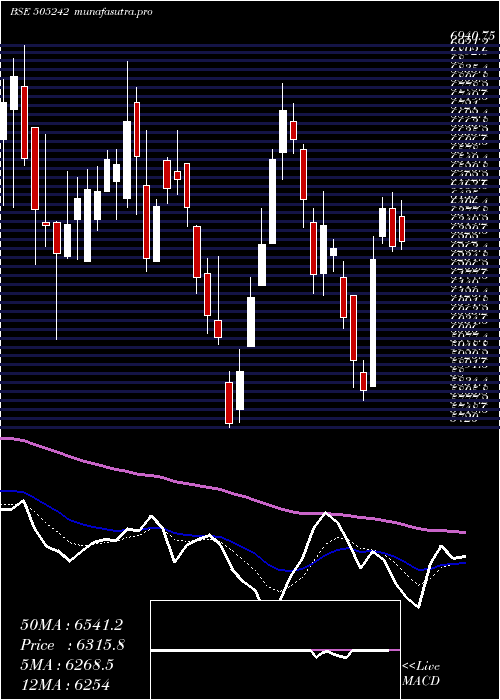
Daily price and volume Dynamat Tech
| Date |
Closing |
Open |
Range |
Volume |
Thu 23 October 2025 |
7999.95 (-1.93%) |
8177.50 |
7923.50 - 8299.00 |
0.2305 times |
Tue 21 October 2025 |
8157.35 (1.26%) |
8150.00 |
8136.00 - 8236.45 |
0.0972 times |
Mon 20 October 2025 |
8055.55 (1.92%) |
7903.45 |
7884.50 - 8092.25 |
0.0991 times |
Fri 17 October 2025 |
7903.45 (-1.01%) |
7954.00 |
7820.00 - 8015.90 |
0.1019 times |
Thu 16 October 2025 |
7984.20 (2.12%) |
7818.80 |
7818.80 - 8255.55 |
0.4717 times |
Wed 15 October 2025 |
7818.80 (0.63%) |
7750.05 |
7717.85 - 7865.00 |
0.1874 times |
Tue 14 October 2025 |
7769.95 (0.32%) |
7753.05 |
7650.00 - 7858.45 |
0.1632 times |
Mon 13 October 2025 |
7745.45 (-0.63%) |
7717.05 |
7625.00 - 7818.50 |
0.1931 times |
Fri 10 October 2025 |
7794.65 (1.67%) |
7602.20 |
7591.60 - 7884.00 |
0.8736 times |
Thu 09 October 2025 |
7666.85 (12.11%) |
6833.55 |
6790.00 - 7776.00 |
7.5822 times |
Wed 08 October 2025 |
6838.85 (-0.7%) |
6911.15 |
6771.70 - 6911.15 |
0.0508 times |
Weekly price and charts DynamatTech Strong weekly Stock price targets for DynamatTech 505242 are 7942.23 and 8356.73 | Weekly Target 1 | 7646.65 | | Weekly Target 2 | 7823.3 | | Weekly Target 3 | 8061.15 | | Weekly Target 4 | 8237.8 | | Weekly Target 5 | 8475.65 |
Weekly price and volumes for Dynamat Tech
| Date |
Closing |
Open |
Range |
Volume |
Thu 23 October 2025 |
7999.95 (1.22%) |
7903.45 |
7884.50 - 8299.00 |
0.1917 times |
Fri 17 October 2025 |
7903.45 (1.4%) |
7717.05 |
7625.00 - 8255.55 |
0.502 times |
Fri 10 October 2025 |
7794.65 (10.76%) |
7040.00 |
6760.05 - 7884.00 |
4.1961 times |
Fri 03 October 2025 |
7037.55 (1.81%) |
6841.55 |
6715.50 - 7318.50 |
0.3091 times |
Fri 26 September 2025 |
6912.45 (-3.99%) |
7188.20 |
6772.40 - 7550.60 |
4.3065 times |
Fri 19 September 2025 |
7199.75 (6.72%) |
6815.00 |
6694.20 - 7300.00 |
0.1793 times |
Fri 12 September 2025 |
6746.10 (2.16%) |
6615.00 |
6508.65 - 6822.00 |
0.073 times |
Fri 05 September 2025 |
6603.25 (2.69%) |
6435.00 |
6417.05 - 6731.20 |
0.0946 times |
Fri 29 August 2025 |
6430.00 (-1.82%) |
6549.00 |
6338.85 - 6588.00 |
0.0768 times |
Fri 22 August 2025 |
6549.35 (1.42%) |
6408.45 |
6408.45 - 6700.00 |
0.071 times |
Thu 14 August 2025 |
6457.85 (-3.18%) |
6899.45 |
6349.45 - 6899.45 |
0.1867 times |

Monthly price and charts DynamatTech Strong monthly Stock price targets for DynamatTech 505242 are 7380 and 8918.95 | Monthly Target 1 | 6147.38 | | Monthly Target 2 | 7073.67 | | Monthly Target 3 | 7686.3333333333 | | Monthly Target 4 | 8612.62 | | Monthly Target 5 | 9225.28 |
Monthly price and volumes Dynamat Tech
| Date |
Closing |
Open |
Range |
Volume |
Thu 23 October 2025 |
7999.95 (16.66%) |
6968.55 |
6760.05 - 8299.00 |
3.0351 times |
Tue 30 September 2025 |
6857.40 (6.65%) |
6435.00 |
6417.05 - 7550.60 |
2.7962 times |
Fri 29 August 2025 |
6430.00 (-3.14%) |
6684.90 |
6335.00 - 6899.45 |
0.3252 times |
Thu 31 July 2025 |
6638.45 (-7.71%) |
7202.30 |
6568.50 - 7457.95 |
0.4247 times |
Mon 30 June 2025 |
7193.05 (4.9%) |
6908.95 |
6467.05 - 7540.60 |
0.6939 times |
Fri 30 May 2025 |
6857.00 (8.22%) |
6335.90 |
6146.30 - 7298.95 |
0.292 times |
Wed 30 April 2025 |
6335.90 (2.05%) |
6213.00 |
5807.40 - 6811.90 |
0.2595 times |
Fri 28 March 2025 |
6208.60 (-7.34%) |
6759.90 |
5720.00 - 6821.15 |
0.6704 times |
Fri 28 February 2025 |
6700.35 (-4.86%) |
7154.40 |
6002.00 - 7159.85 |
0.4209 times |
Fri 31 January 2025 |
7042.70 (-16.73%) |
8471.80 |
6525.55 - 8640.00 |
1.0822 times |
Tue 31 December 2024 |
8457.75 (9.72%) |
7724.95 |
7724.95 - 8952.95 |
0.8653 times |

DMA SMA EMA moving averages of Dynamat Tech 505242
DMA (daily moving average) of Dynamat Tech 505242
| DMA period | DMA value | | 5 day DMA | 8020.1 | | 12 day DMA | 7718.48 | | 20 day DMA | 7404.46 | | 35 day DMA | 7160.64 | | 50 day DMA | 6978.08 | | 100 day DMA | 6986.89 | | 150 day DMA | 6817.47 | | 200 day DMA | 6905.87 | EMA (exponential moving average) of Dynamat Tech 505242
| EMA period | EMA current | EMA prev | EMA prev2 | | 5 day EMA | 7988.4 | 7982.63 | 7895.29 | | 12 day EMA | 7756.13 | 7711.81 | 7630.83 | | 20 day EMA | 7545.64 | 7497.84 | 7428.45 | | 35 day EMA | 7275.14 | 7232.47 | 7178.02 | | 50 day EMA | 7050.68 | 7011.95 | 6965.22 |
SMA (simple moving average) of Dynamat Tech 505242
| SMA period | SMA current | SMA prev | SMA prev2 | | 5 day SMA | 8020.1 | 7983.87 | 7906.39 | | 12 day SMA | 7718.48 | 7628.8 | 7535.48 | | 20 day SMA | 7404.46 | 7359.45 | 7310.13 | | 35 day SMA | 7160.64 | 7120.79 | 7075.46 | | 50 day SMA | 6978.08 | 6951.49 | 6918.31 | | 100 day SMA | 6986.89 | 6976.32 | 6963.98 | | 150 day SMA | 6817.47 | 6807.36 | 6795.83 | | 200 day SMA | 6905.87 | 6909.52 | 6910.1 |
|
|
