IndHume 504741 full analysis,charts,indicators,moving averages,SMA,DMA,EMA,ADX,MACD,RSIInd Hume 504741 WideScreen charts, DMA,SMA,EMA technical analysis, forecast prediction, by indicators ADX,MACD,RSI,CCI BSE stock exchange
Daily price and charts and targets IndHume Strong Daily Stock price targets for IndHume 504741 are 396.05 and 413.5 | Daily Target 1 | 381.58 | | Daily Target 2 | 393.07 | | Daily Target 3 | 399.03333333333 | | Daily Target 4 | 410.52 | | Daily Target 5 | 416.48 |
Daily price and volume Ind Hume
| Date |
Closing |
Open |
Range |
Volume |
Wed 03 September 2025 |
404.55 (4.32%) |
388.90 |
387.55 - 405.00 |
1.6774 times |
Tue 02 September 2025 |
387.80 (3.9%) |
371.60 |
370.10 - 396.60 |
3.9083 times |
Mon 01 September 2025 |
373.25 (3.34%) |
372.05 |
362.55 - 374.30 |
2.243 times |
Fri 29 August 2025 |
361.20 (-1.73%) |
367.55 |
359.00 - 374.25 |
0.5887 times |
Thu 28 August 2025 |
367.55 (-1.91%) |
374.70 |
364.65 - 374.70 |
0.2278 times |
Tue 26 August 2025 |
374.70 (1.53%) |
368.35 |
367.90 - 376.15 |
0.2058 times |
Mon 25 August 2025 |
369.05 (-2.47%) |
375.75 |
368.00 - 380.75 |
0.1819 times |
Fri 22 August 2025 |
378.40 (-0.93%) |
381.70 |
377.90 - 381.70 |
0.1224 times |
Thu 21 August 2025 |
381.95 (-1.32%) |
387.10 |
381.50 - 389.45 |
0.316 times |
Wed 20 August 2025 |
387.05 (-1.26%) |
388.60 |
385.80 - 390.00 |
0.5288 times |
Tue 19 August 2025 |
392.00 (6.1%) |
370.20 |
370.20 - 394.55 |
1.1957 times |
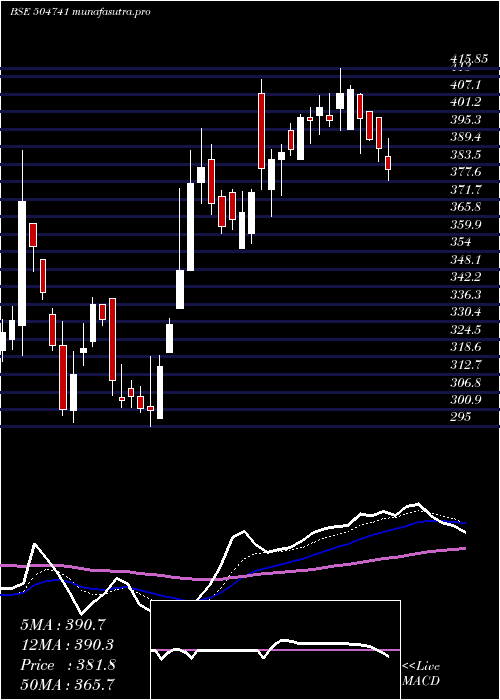
Weekly price and charts IndHume Strong weekly Stock price targets for IndHume 504741 are 383.55 and 426 | Weekly Target 1 | 348.25 | | Weekly Target 2 | 376.4 | | Weekly Target 3 | 390.7 | | Weekly Target 4 | 418.85 | | Weekly Target 5 | 433.15 |
Weekly price and volumes for Ind Hume
| Date |
Closing |
Open |
Range |
Volume |
Wed 03 September 2025 |
404.55 (12%) |
372.05 |
362.55 - 405.00 |
0.913 times |
Fri 29 August 2025 |
361.20 (-4.55%) |
375.75 |
359.00 - 380.75 |
0.1404 times |
Fri 22 August 2025 |
378.40 (2.6%) |
368.00 |
367.00 - 394.55 |
0.4299 times |
Thu 14 August 2025 |
368.80 (-6.69%) |
395.25 |
354.55 - 413.90 |
1.1344 times |
Fri 08 August 2025 |
395.25 (-3.27%) |
421.80 |
392.00 - 421.80 |
0.695 times |
Fri 01 August 2025 |
408.60 (-3.58%) |
439.00 |
406.10 - 439.00 |
0.639 times |
Fri 25 July 2025 |
423.75 (-4.61%) |
449.80 |
420.40 - 449.80 |
0.7513 times |
Fri 18 July 2025 |
444.25 (1.35%) |
438.35 |
434.55 - 467.95 |
1.4832 times |
Fri 11 July 2025 |
438.35 (-4.51%) |
455.20 |
435.00 - 490.00 |
0.8322 times |
Fri 04 July 2025 |
459.05 (7.38%) |
430.00 |
427.85 - 478.00 |
2.9816 times |
Fri 27 June 2025 |
427.50 (7.47%) |
429.90 |
399.00 - 437.95 |
0.9583 times |
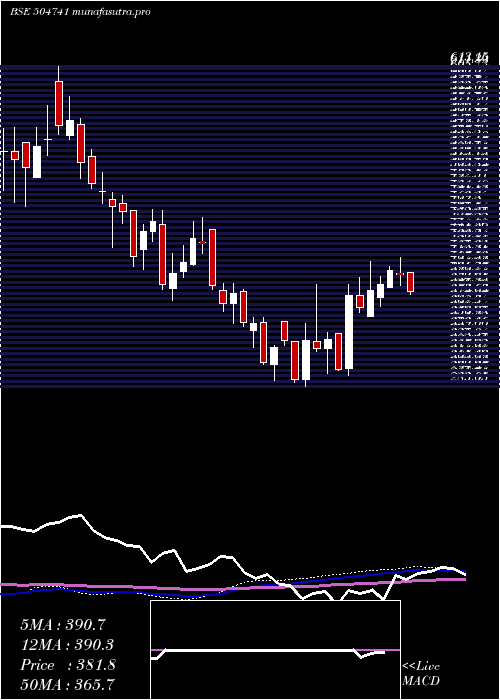
Monthly price and charts IndHume Strong monthly Stock price targets for IndHume 504741 are 383.55 and 426 | Monthly Target 1 | 348.25 | | Monthly Target 2 | 376.4 | | Monthly Target 3 | 390.7 | | Monthly Target 4 | 418.85 | | Monthly Target 5 | 433.15 |
Monthly price and volumes Ind Hume
| Date |
Closing |
Open |
Range |
Volume |
Wed 03 September 2025 |
404.55 (12%) |
372.05 |
362.55 - 405.00 |
0.1586 times |
Fri 29 August 2025 |
361.20 (-11.99%) |
418.75 |
354.55 - 425.00 |
0.4531 times |
Thu 31 July 2025 |
410.40 (-5.56%) |
440.35 |
406.35 - 490.00 |
1.0718 times |
Mon 30 June 2025 |
434.55 (1.64%) |
437.00 |
396.00 - 460.20 |
0.9476 times |
Fri 30 May 2025 |
427.55 (12%) |
390.00 |
367.30 - 449.85 |
1.4413 times |
Wed 30 April 2025 |
381.75 (4.65%) |
355.00 |
355.00 - 415.85 |
0.8719 times |
Fri 28 March 2025 |
364.80 (13.17%) |
322.40 |
295.00 - 395.70 |
1.7459 times |
Fri 28 February 2025 |
322.35 (-0.25%) |
350.00 |
283.05 - 388.00 |
1.4367 times |
Fri 31 January 2025 |
323.15 (-10.44%) |
365.00 |
289.75 - 389.70 |
1.034 times |
Tue 31 December 2024 |
360.80 (-12.27%) |
409.00 |
348.00 - 457.60 |
0.839 times |
Fri 29 November 2024 |
411.25 (-7.31%) |
438.00 |
372.35 - 466.00 |
0.7354 times |

DMA SMA EMA moving averages of Ind Hume 504741
DMA (daily moving average) of Ind Hume 504741
| DMA period | DMA value | | 5 day DMA | 378.87 | | 12 day DMA | 378.91 | | 20 day DMA | 383.21 | | 35 day DMA | 402.54 | | 50 day DMA | 413.89 | | 100 day DMA | 412.13 | | 150 day DMA | 384.56 | | 200 day DMA | 388.88 | EMA (exponential moving average) of Ind Hume 504741
| EMA period | EMA current | EMA prev | EMA prev2 | | 5 day EMA | 385.78 | 376.39 | 370.68 | | 12 day EMA | 382.61 | 378.62 | 376.95 | | 20 day EMA | 387.04 | 385.2 | 384.93 | | 35 day EMA | 397.33 | 396.91 | 397.45 | | 50 day EMA | 410.23 | 410.46 | 411.38 |
SMA (simple moving average) of Ind Hume 504741
| SMA period | SMA current | SMA prev | SMA prev2 | | 5 day SMA | 378.87 | 372.9 | 369.15 | | 12 day SMA | 378.91 | 375.93 | 375.42 | | 20 day SMA | 383.21 | 383.84 | 384.88 | | 35 day SMA | 402.54 | 403.52 | 404.97 | | 50 day SMA | 413.89 | 413.82 | 414.02 | | 100 day SMA | 412.13 | 411.82 | 411.62 | | 150 day SMA | 384.56 | 384.2 | 383.91 | | 200 day SMA | 388.88 | 389.06 | 389.33 |
|
|
