Nyssacorp 504378 full analysis,charts,indicators,moving averages,SMA,DMA,EMA,ADX,MACD,RSINyssacorp 504378 WideScreen charts, DMA,SMA,EMA technical analysis, forecast prediction, by indicators ADX,MACD,RSI,CCI BSE stock exchange
Daily price and charts and targets Nyssacorp Strong Daily Stock price targets for Nyssacorp 504378 are 3.48 and 3.77 | Daily Target 1 | 3.41 | | Daily Target 2 | 3.55 | | Daily Target 3 | 3.6966666666667 | | Daily Target 4 | 3.84 | | Daily Target 5 | 3.99 |
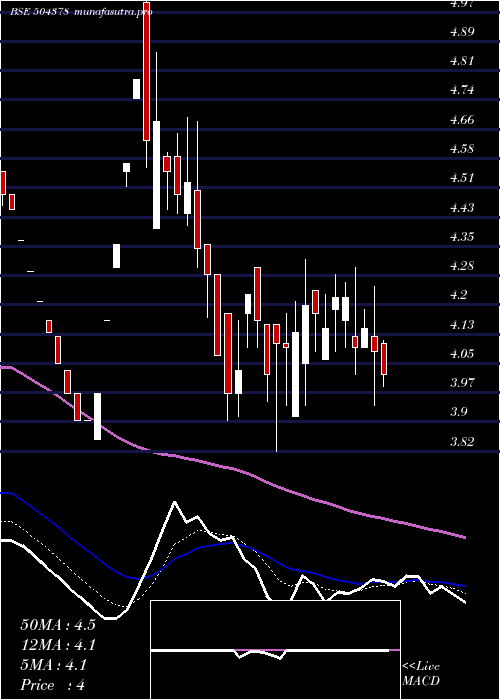
Daily price and volume Nyssacorp
| Date |
Closing |
Open |
Range |
Volume |
Fri 05 December 2025 |
3.70 (3.64%) |
3.84 |
3.55 - 3.84 |
0.8088 times |
Thu 04 December 2025 |
3.57 (-7.51%) |
4.00 |
3.53 - 4.00 |
2.9896 times |
Wed 03 December 2025 |
3.86 (-1.03%) |
4.06 |
3.77 - 4.06 |
0.8978 times |
Tue 02 December 2025 |
3.90 (-1.02%) |
3.94 |
3.87 - 4.08 |
0.4393 times |
Mon 01 December 2025 |
3.94 (0.51%) |
3.91 |
3.83 - 4.10 |
1.2065 times |
Fri 28 November 2025 |
3.92 (-0.76%) |
3.95 |
3.70 - 4.07 |
0.5291 times |
Thu 27 November 2025 |
3.95 (0%) |
4.10 |
3.90 - 4.10 |
0.4948 times |
Wed 26 November 2025 |
3.95 (-2.47%) |
4.00 |
3.80 - 4.02 |
1.1821 times |
Tue 25 November 2025 |
4.05 (1.76%) |
4.09 |
3.92 - 4.09 |
1.0284 times |
Mon 24 November 2025 |
3.98 (-0.5%) |
3.93 |
3.93 - 4.04 |
0.4235 times |
Fri 21 November 2025 |
4.00 (-0.99%) |
3.97 |
3.90 - 4.02 |
1.2483 times |
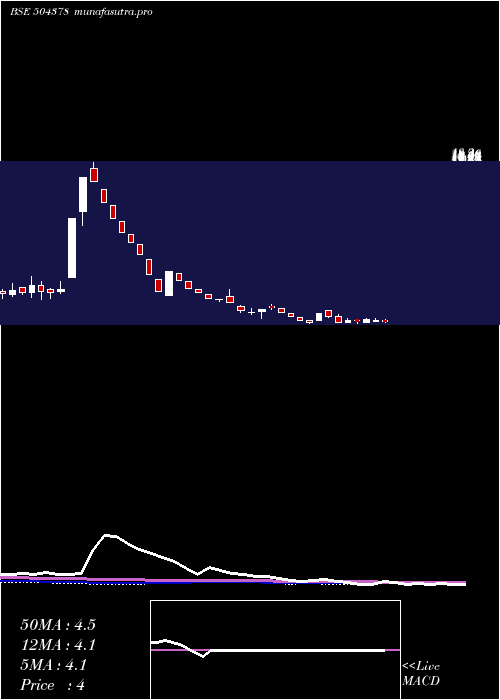
Weekly price and charts Nyssacorp Strong weekly Stock price targets for Nyssacorp 504378 are 3.33 and 3.9 | Weekly Target 1 | 3.21 | | Weekly Target 2 | 3.45 | | Weekly Target 3 | 3.7766666666667 | | Weekly Target 4 | 4.02 | | Weekly Target 5 | 4.35 |
Weekly price and volumes for Nyssacorp
| Date |
Closing |
Open |
Range |
Volume |
Fri 05 December 2025 |
3.70 (-5.61%) |
3.91 |
3.53 - 4.10 |
0.7079 times |
Fri 28 November 2025 |
3.92 (-2%) |
3.93 |
3.70 - 4.10 |
0.4083 times |
Fri 21 November 2025 |
4.00 (-6.1%) |
4.25 |
3.90 - 4.30 |
0.512 times |
Fri 14 November 2025 |
4.26 (7.85%) |
4.06 |
3.97 - 4.33 |
0.3818 times |
Fri 07 November 2025 |
3.95 (-1.5%) |
3.99 |
3.92 - 4.15 |
0.2943 times |
Fri 31 October 2025 |
4.01 (-7.39%) |
4.01 |
3.96 - 4.25 |
0.5275 times |
Thu 23 October 2025 |
4.33 (2.36%) |
4.34 |
4.23 - 4.59 |
0.1424 times |
Fri 17 October 2025 |
4.23 (-9.62%) |
4.55 |
4.00 - 4.75 |
3.5852 times |
Fri 10 October 2025 |
4.68 (-12.85%) |
5.26 |
4.59 - 5.87 |
1.4463 times |
Fri 03 October 2025 |
5.37 (24.88%) |
4.25 |
4.25 - 5.42 |
1.9943 times |
Fri 26 September 2025 |
4.30 (-3.37%) |
4.33 |
4.24 - 4.72 |
1.3911 times |
Monthly price and charts Nyssacorp Strong monthly Stock price targets for Nyssacorp 504378 are 3.33 and 3.9 | Monthly Target 1 | 3.21 | | Monthly Target 2 | 3.45 | | Monthly Target 3 | 3.7766666666667 | | Monthly Target 4 | 4.02 | | Monthly Target 5 | 4.35 |
Monthly price and volumes Nyssacorp
| Date |
Closing |
Open |
Range |
Volume |
Fri 05 December 2025 |
3.70 (-5.61%) |
3.91 |
3.53 - 4.10 |
0.2566 times |
Fri 28 November 2025 |
3.92 (-2.24%) |
3.99 |
3.70 - 4.33 |
0.5787 times |
Fri 31 October 2025 |
4.01 (-10.69%) |
4.69 |
3.96 - 5.87 |
2.6461 times |
Tue 30 September 2025 |
4.49 (25.42%) |
3.58 |
3.58 - 4.87 |
1.8091 times |
Fri 29 August 2025 |
3.58 (-9.6%) |
3.92 |
3.41 - 4.06 |
0.6765 times |
Thu 31 July 2025 |
3.96 (-1.74%) |
4.05 |
3.64 - 4.23 |
0.8325 times |
Mon 30 June 2025 |
4.03 (1.26%) |
4.02 |
3.83 - 4.20 |
0.7309 times |
Fri 30 May 2025 |
3.98 (-1%) |
4.02 |
3.66 - 4.14 |
0.7042 times |
Wed 30 April 2025 |
4.02 (1.26%) |
3.97 |
3.82 - 4.32 |
0.6974 times |
Fri 28 March 2025 |
3.97 (-3.87%) |
4.12 |
3.85 - 5.02 |
1.068 times |
Fri 28 February 2025 |
4.13 (-19.65%) |
5.39 |
4.13 - 5.56 |
0.5928 times |

DMA SMA EMA moving averages of Nyssacorp 504378
DMA (daily moving average) of Nyssacorp 504378
| DMA period | DMA value | | 5 day DMA | 3.79 | | 12 day DMA | 3.91 | | 20 day DMA | 3.97 | | 35 day DMA | 4.07 | | 50 day DMA | 4.25 | | 100 day DMA | 4.1 | | 150 day DMA | 4.07 | | 200 day DMA | 4.16 | EMA (exponential moving average) of Nyssacorp 504378
| EMA period | EMA current | EMA prev | EMA prev2 | | 5 day EMA | 3.77 | 3.8 | 3.91 | | 12 day EMA | 3.87 | 3.9 | 3.96 | | 20 day EMA | 3.95 | 3.98 | 4.02 | | 35 day EMA | 4.08 | 4.1 | 4.13 | | 50 day EMA | 4.21 | 4.23 | 4.26 |
SMA (simple moving average) of Nyssacorp 504378
| SMA period | SMA current | SMA prev | SMA prev2 | | 5 day SMA | 3.79 | 3.84 | 3.91 | | 12 day SMA | 3.91 | 3.93 | 3.97 | | 20 day SMA | 3.97 | 3.99 | 4.02 | | 35 day SMA | 4.07 | 4.1 | 4.13 | | 50 day SMA | 4.25 | 4.27 | 4.28 | | 100 day SMA | 4.1 | 4.1 | 4.11 | | 150 day SMA | 4.07 | 4.07 | 4.08 | | 200 day SMA | 4.16 | 4.17 | 4.18 |
|
|
