UnivCable 504212 full analysis,charts,indicators,moving averages,SMA,DMA,EMA,ADX,MACD,RSIUniv Cable 504212 WideScreen charts, DMA,SMA,EMA technical analysis, forecast prediction, by indicators ADX,MACD,RSI,CCI BSE stock exchange
Daily price and charts and targets UnivCable Strong Daily Stock price targets for UnivCable 504212 are 698.75 and 705.3 | Daily Target 1 | 697.23 | | Daily Target 2 | 700.27 | | Daily Target 3 | 703.78333333333 | | Daily Target 4 | 706.82 | | Daily Target 5 | 710.33 |
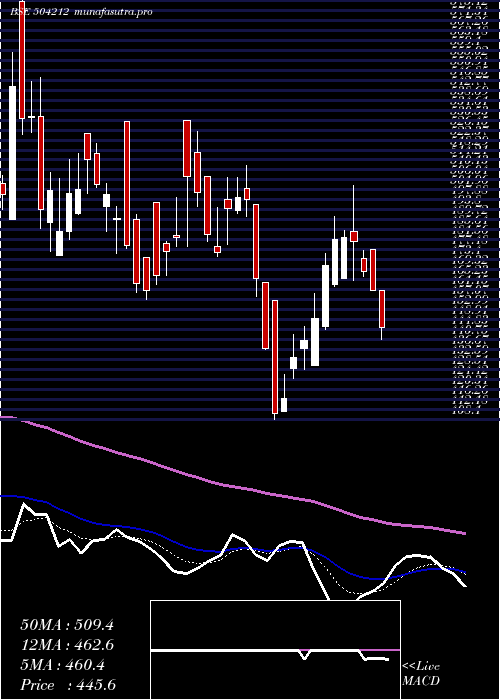
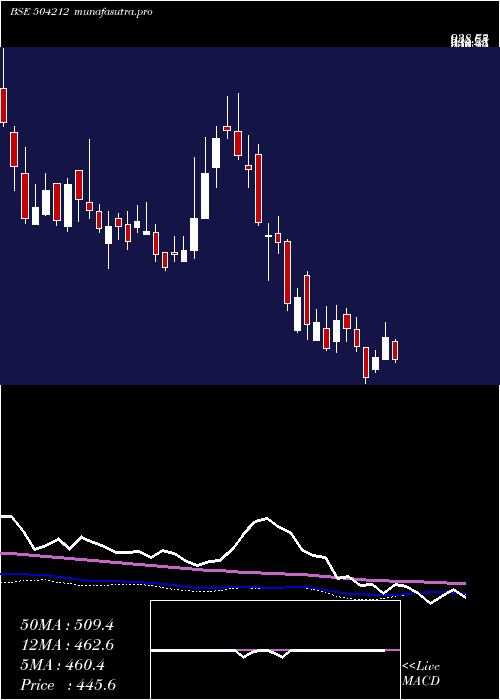
Daily price and volume Univ Cable
| Date |
Closing |
Open |
Range |
Volume |
Thu 23 October 2025 |
703.30 (-1.48%) |
707.30 |
700.75 - 707.30 |
0.3563 times |
Tue 21 October 2025 |
713.85 (0.25%) |
710.25 |
703.10 - 716.05 |
0.0944 times |
Mon 20 October 2025 |
712.05 (5.01%) |
682.95 |
678.50 - 722.45 |
1.5761 times |
Fri 17 October 2025 |
678.05 (-2.38%) |
697.30 |
675.30 - 700.15 |
0.3271 times |
Thu 16 October 2025 |
694.60 (0.88%) |
690.00 |
690.00 - 707.10 |
0.4664 times |
Wed 15 October 2025 |
688.55 (0.01%) |
676.65 |
676.65 - 692.35 |
0.6042 times |
Tue 14 October 2025 |
688.50 (0.59%) |
686.00 |
660.00 - 690.25 |
1.5986 times |
Mon 13 October 2025 |
684.45 (-2.67%) |
703.20 |
677.20 - 703.20 |
4.1081 times |
Fri 10 October 2025 |
703.20 (0.29%) |
703.10 |
696.05 - 705.10 |
0.456 times |
Thu 09 October 2025 |
701.15 (0.51%) |
699.15 |
694.50 - 712.55 |
0.4127 times |
Wed 08 October 2025 |
697.60 (-1.57%) |
700.05 |
696.20 - 712.55 |
0.2828 times |
Weekly price and charts UnivCable Strong weekly Stock price targets for UnivCable 504212 are 690.9 and 734.85 | Weekly Target 1 | 657.47 | | Weekly Target 2 | 680.38 | | Weekly Target 3 | 701.41666666667 | | Weekly Target 4 | 724.33 | | Weekly Target 5 | 745.37 |
Weekly price and volumes for Univ Cable
| Date |
Closing |
Open |
Range |
Volume |
Thu 23 October 2025 |
703.30 (3.72%) |
682.95 |
678.50 - 722.45 |
0.2919 times |
Fri 17 October 2025 |
678.05 (-3.58%) |
703.20 |
660.00 - 707.10 |
1.0233 times |
Fri 10 October 2025 |
703.20 (-1.65%) |
705.05 |
694.50 - 730.00 |
0.4687 times |
Fri 03 October 2025 |
715.00 (-0.47%) |
722.00 |
690.05 - 729.90 |
0.6025 times |
Fri 26 September 2025 |
718.35 (-10.26%) |
819.45 |
715.45 - 823.60 |
1.2638 times |
Fri 19 September 2025 |
800.45 (11.57%) |
719.65 |
707.55 - 805.00 |
3.2078 times |
Fri 12 September 2025 |
717.45 (1.21%) |
711.00 |
707.70 - 738.15 |
0.6884 times |
Fri 05 September 2025 |
708.85 (-0.15%) |
708.15 |
703.45 - 744.90 |
0.5789 times |
Fri 29 August 2025 |
709.90 (-0.82%) |
715.00 |
707.00 - 750.65 |
0.4259 times |
Fri 22 August 2025 |
715.75 (-2.27%) |
734.85 |
704.65 - 765.10 |
1.4489 times |
Thu 14 August 2025 |
732.40 (4.75%) |
799.95 |
700.00 - 799.95 |
1.7403 times |
Monthly price and charts UnivCable Strong monthly Stock price targets for UnivCable 504212 are 681.65 and 751.65 | Monthly Target 1 | 627.77 | | Monthly Target 2 | 665.53 | | Monthly Target 3 | 697.76666666667 | | Monthly Target 4 | 735.53 | | Monthly Target 5 | 767.77 |
Monthly price and volumes Univ Cable
| Date |
Closing |
Open |
Range |
Volume |
Thu 23 October 2025 |
703.30 (-0.45%) |
690.05 |
660.00 - 730.00 |
0.34 times |
Tue 30 September 2025 |
706.45 (-0.49%) |
708.15 |
703.45 - 823.60 |
1.0456 times |
Fri 29 August 2025 |
709.90 (-4.99%) |
733.40 |
689.65 - 799.95 |
0.6916 times |
Thu 31 July 2025 |
747.20 (-4.33%) |
771.05 |
712.00 - 848.00 |
0.6231 times |
Mon 30 June 2025 |
781.05 (30.95%) |
589.85 |
583.50 - 795.85 |
0.9902 times |
Fri 30 May 2025 |
596.45 (33.85%) |
450.00 |
421.90 - 641.40 |
2.4819 times |
Wed 30 April 2025 |
445.60 (-9.86%) |
493.45 |
408.10 - 512.05 |
0.6225 times |
Fri 28 March 2025 |
494.35 (-1.46%) |
475.05 |
457.20 - 530.50 |
1.0256 times |
Fri 28 February 2025 |
501.65 (-21.89%) |
645.05 |
476.55 - 671.95 |
0.5965 times |
Fri 31 January 2025 |
642.25 (-21.7%) |
819.60 |
570.20 - 867.55 |
1.5829 times |
Tue 31 December 2024 |
820.25 (33.94%) |
601.60 |
601.60 - 862.30 |
4.3147 times |

DMA SMA EMA moving averages of Univ Cable 504212
DMA (daily moving average) of Univ Cable 504212
| DMA period | DMA value | | 5 day DMA | 700.37 | | 12 day DMA | 697.84 | | 20 day DMA | 708.02 | | 35 day DMA | 720.7 | | 50 day DMA | 721.41 | | 100 day DMA | 719.59 | | 150 day DMA | 646.52 | | 200 day DMA | 649.17 | EMA (exponential moving average) of Univ Cable 504212
| EMA period | EMA current | EMA prev | EMA prev2 | | 5 day EMA | 702.52 | 702.13 | 696.27 | | 12 day EMA | 703.12 | 703.09 | 701.13 | | 20 day EMA | 708.01 | 708.51 | 707.95 | | 35 day EMA | 711.92 | 712.43 | 712.35 | | 50 day EMA | 718.55 | 719.17 | 719.39 |
SMA (simple moving average) of Univ Cable 504212
| SMA period | SMA current | SMA prev | SMA prev2 | | 5 day SMA | 700.37 | 697.42 | 692.35 | | 12 day SMA | 697.84 | 698.99 | 699.08 | | 20 day SMA | 708.02 | 711.05 | 714.01 | | 35 day SMA | 720.7 | 721.32 | 721.21 | | 50 day SMA | 721.41 | 721.33 | 721.17 | | 100 day SMA | 719.59 | 718.47 | 717.32 | | 150 day SMA | 646.52 | 645.26 | 643.85 | | 200 day SMA | 649.17 | 649.56 | 649.77 |
|
|
