HighEnergy 504176 full analysis,charts,indicators,moving averages,SMA,DMA,EMA,ADX,MACD,RSIHigh Energy 504176 WideScreen charts, DMA,SMA,EMA technical analysis, forecast prediction, by indicators ADX,MACD,RSI,CCI BSE stock exchange
Daily price and charts and targets HighEnergy Strong Daily Stock price targets for HighEnergy 504176 are 627 and 642.2 | Daily Target 1 | 623.4 | | Daily Target 2 | 630.6 | | Daily Target 3 | 638.6 | | Daily Target 4 | 645.8 | | Daily Target 5 | 653.8 |
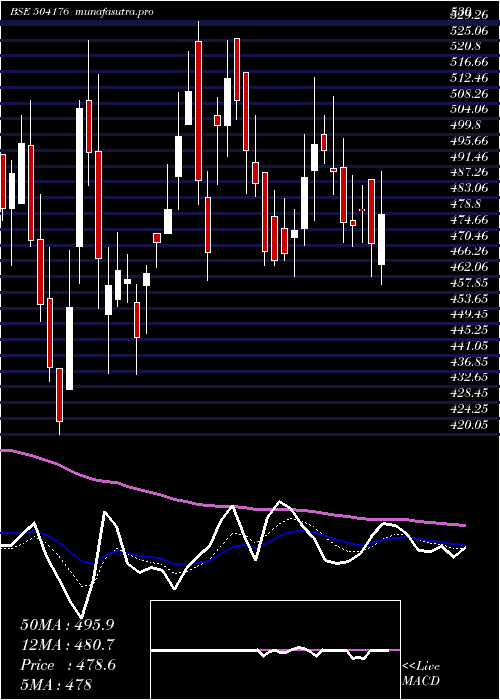
Daily price and volume High Energy
| Date |
Closing |
Open |
Range |
Volume |
Tue 21 October 2025 |
637.80 (1.01%) |
646.60 |
631.40 - 646.60 |
0.8301 times |
Mon 20 October 2025 |
631.40 (3.75%) |
619.90 |
592.40 - 647.00 |
1.7813 times |
Fri 17 October 2025 |
608.55 (1.14%) |
614.00 |
602.05 - 629.80 |
1.0256 times |
Thu 16 October 2025 |
601.70 (-0.4%) |
596.40 |
596.00 - 614.95 |
0.5436 times |
Wed 15 October 2025 |
604.10 (-0.4%) |
602.00 |
592.15 - 616.95 |
0.6486 times |
Tue 14 October 2025 |
606.55 (0.51%) |
603.50 |
580.00 - 619.85 |
1.4575 times |
Mon 13 October 2025 |
603.45 (0.19%) |
616.00 |
584.25 - 622.00 |
1.1241 times |
Fri 10 October 2025 |
602.30 (0.41%) |
600.00 |
587.90 - 625.00 |
0.5287 times |
Thu 09 October 2025 |
599.85 (-2.37%) |
614.05 |
591.00 - 623.95 |
1.1629 times |
Wed 08 October 2025 |
614.40 (-0.75%) |
631.70 |
611.00 - 635.00 |
0.8976 times |
Tue 07 October 2025 |
619.05 (-2.23%) |
600.00 |
600.00 - 632.00 |
1.2678 times |
Weekly price and charts HighEnergy Strong weekly Stock price targets for HighEnergy 504176 are 615.1 and 669.7 | Weekly Target 1 | 571.13 | | Weekly Target 2 | 604.47 | | Weekly Target 3 | 625.73333333333 | | Weekly Target 4 | 659.07 | | Weekly Target 5 | 680.33 |
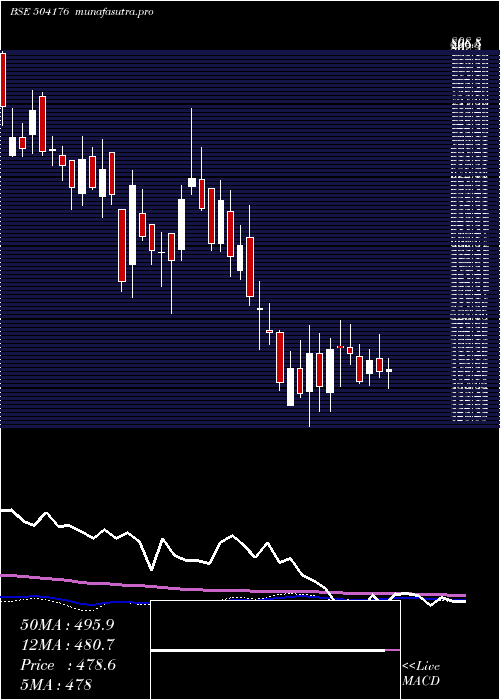
Weekly price and volumes for High Energy
| Date |
Closing |
Open |
Range |
Volume |
Tue 21 October 2025 |
637.80 (4.81%) |
619.90 |
592.40 - 647.00 |
0.3689 times |
Fri 17 October 2025 |
608.55 (1.04%) |
616.00 |
580.00 - 629.80 |
0.678 times |
Fri 10 October 2025 |
602.30 (-6.58%) |
657.00 |
587.90 - 669.00 |
0.831 times |
Fri 03 October 2025 |
644.70 (9.22%) |
590.50 |
513.15 - 667.90 |
3.63 times |
Fri 26 September 2025 |
590.30 (-2.57%) |
629.00 |
575.55 - 629.00 |
0.5733 times |
Fri 19 September 2025 |
605.85 (-6.4%) |
641.00 |
595.10 - 654.95 |
1.3153 times |
Fri 12 September 2025 |
647.25 (-1.14%) |
654.80 |
634.25 - 665.00 |
0.4922 times |
Fri 05 September 2025 |
654.70 (-1.87%) |
685.00 |
651.00 - 685.00 |
0.5596 times |
Fri 29 August 2025 |
667.15 (5.04%) |
618.00 |
618.00 - 677.00 |
0.6864 times |
Fri 22 August 2025 |
635.15 (3.34%) |
629.00 |
596.10 - 653.80 |
0.8655 times |
Thu 14 August 2025 |
614.65 (-4.72%) |
677.35 |
602.05 - 677.35 |
0.5201 times |
Monthly price and charts HighEnergy Strong monthly Stock price targets for HighEnergy 504176 are 591.88 and 714.93 | Monthly Target 1 | 494.53 | | Monthly Target 2 | 566.17 | | Monthly Target 3 | 617.58333333333 | | Monthly Target 4 | 689.22 | | Monthly Target 5 | 740.63 |
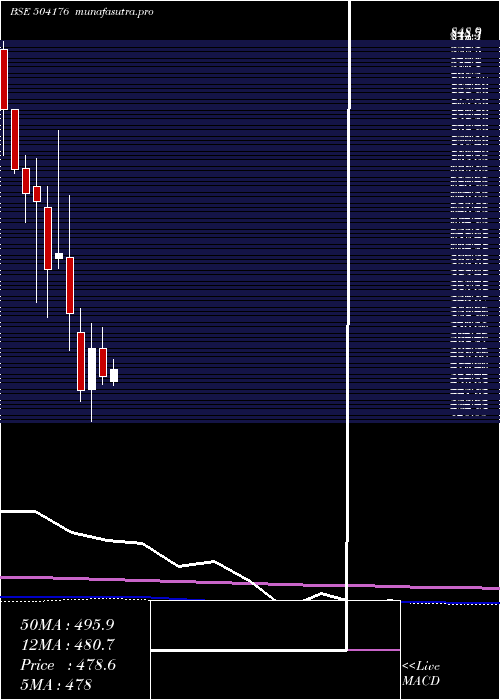
Monthly price and volumes High Energy
| Date |
Closing |
Open |
Range |
Volume |
Tue 21 October 2025 |
637.80 (23.01%) |
555.00 |
545.95 - 669.00 |
0.6368 times |
Tue 30 September 2025 |
518.50 (-22.28%) |
685.00 |
513.15 - 685.00 |
0.7186 times |
Fri 29 August 2025 |
667.15 (5.05%) |
622.35 |
557.40 - 677.35 |
0.5672 times |
Thu 31 July 2025 |
635.05 (-20.37%) |
782.10 |
635.05 - 804.00 |
0.8642 times |
Mon 30 June 2025 |
797.50 (11.32%) |
718.00 |
650.00 - 830.35 |
1.4439 times |
Fri 30 May 2025 |
716.40 (52.18%) |
465.15 |
432.00 - 731.00 |
2.4966 times |
Wed 30 April 2025 |
470.75 (-6.28%) |
502.20 |
462.00 - 525.50 |
0.5567 times |
Fri 28 March 2025 |
502.30 (10.52%) |
456.20 |
420.05 - 530.00 |
0.9699 times |
Fri 28 February 2025 |
454.50 (-16.15%) |
520.00 |
442.05 - 547.90 |
1.0322 times |
Fri 31 January 2025 |
542.05 (-11.1%) |
605.00 |
500.00 - 674.95 |
0.7139 times |
Tue 31 December 2024 |
609.70 (3.04%) |
603.55 |
592.10 - 748.90 |
0.8028 times |
DMA SMA EMA moving averages of High Energy 504176
DMA (daily moving average) of High Energy 504176
| DMA period | DMA value | | 5 day DMA | 616.71 | | 12 day DMA | 613.53 | | 20 day DMA | 605.28 | | 35 day DMA | 618.54 | | 50 day DMA | 623.9 | | 100 day DMA | 668.98 | | 150 day DMA | 622.54 | | 200 day DMA | 603.43 | EMA (exponential moving average) of High Energy 504176
| EMA period | EMA current | EMA prev | EMA prev2 | | 5 day EMA | 622.1 | 614.25 | 605.68 | | 12 day EMA | 614.29 | 610.02 | 606.13 | | 20 day EMA | 612.95 | 610.33 | 608.11 | | 35 day EMA | 615.54 | 614.23 | 613.22 | | 50 day EMA | 621.1 | 620.42 | 619.97 |
SMA (simple moving average) of High Energy 504176
| SMA period | SMA current | SMA prev | SMA prev2 | | 5 day SMA | 616.71 | 610.46 | 604.87 | | 12 day SMA | 613.53 | 614.1 | 613.33 | | 20 day SMA | 605.28 | 603.76 | 602.48 | | 35 day SMA | 618.54 | 619.34 | 620.36 | | 50 day SMA | 623.9 | 623.44 | 622.51 | | 100 day SMA | 668.98 | 669.75 | 670.36 | | 150 day SMA | 622.54 | 621.31 | 619.93 | | 200 day SMA | 603.43 | 603.41 | 603.48 |
|
|
