Indokem 504092 full analysis,charts,indicators,moving averages,SMA,DMA,EMA,ADX,MACD,RSIIndokem 504092 WideScreen charts, DMA,SMA,EMA technical analysis, forecast prediction, by indicators ADX,MACD,RSI,CCI BSE stock exchange
Daily price and charts and targets Indokem Strong Daily Stock price targets for Indokem 504092 are 556.98 and 585.93 | Daily Target 1 | 534.37 | | Daily Target 2 | 550.63 | | Daily Target 3 | 563.31666666667 | | Daily Target 4 | 579.58 | | Daily Target 5 | 592.27 |
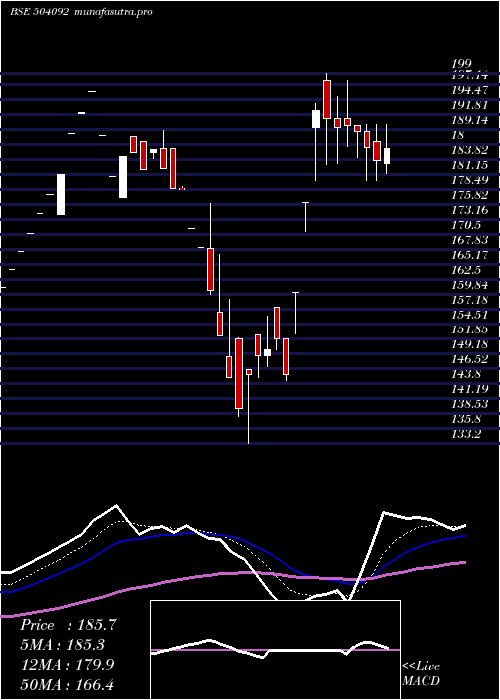
Daily price and volume Indokem
| Date |
Closing |
Open |
Range |
Volume |
Thu 23 October 2025 |
566.90 (3.26%) |
549.00 |
547.05 - 576.00 |
1.4091 times |
Tue 21 October 2025 |
549.00 (0.08%) |
551.75 |
540.00 - 564.40 |
0.8922 times |
Mon 20 October 2025 |
548.55 (2.05%) |
537.60 |
525.00 - 559.80 |
1.0163 times |
Fri 17 October 2025 |
537.55 (-0.13%) |
535.00 |
517.10 - 554.95 |
0.7412 times |
Thu 16 October 2025 |
538.25 (1.64%) |
529.90 |
526.50 - 556.00 |
1.1528 times |
Wed 15 October 2025 |
529.55 (-0.4%) |
532.00 |
505.15 - 558.25 |
1.4172 times |
Tue 14 October 2025 |
531.70 (3.32%) |
491.10 |
491.10 - 540.00 |
1.3984 times |
Mon 13 October 2025 |
514.60 (-4.32%) |
528.05 |
511.00 - 560.00 |
1.2212 times |
Fri 10 October 2025 |
537.85 (-2%) |
537.85 |
537.85 - 537.85 |
0.1911 times |
Thu 09 October 2025 |
548.80 (-2%) |
570.00 |
548.80 - 570.00 |
0.5606 times |
Wed 08 October 2025 |
560.00 (1.96%) |
560.00 |
560.00 - 560.00 |
0.5726 times |
Weekly price and charts Indokem Strong weekly Stock price targets for Indokem 504092 are 545.95 and 596.95 | Weekly Target 1 | 504.97 | | Weekly Target 2 | 535.93 | | Weekly Target 3 | 555.96666666667 | | Weekly Target 4 | 586.93 | | Weekly Target 5 | 606.97 |
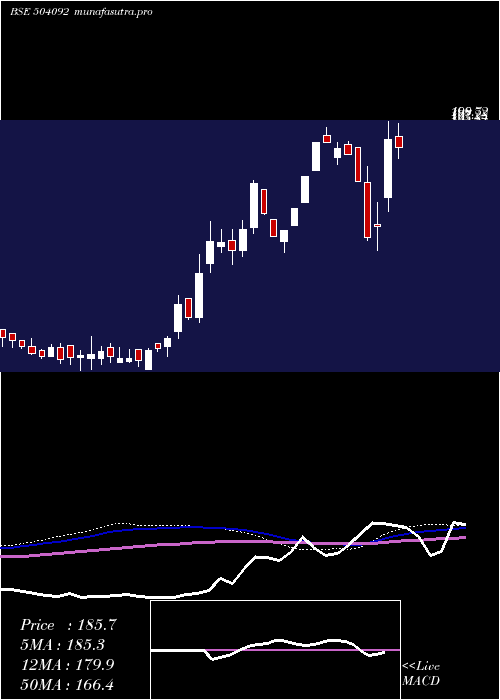
Weekly price and volumes for Indokem
| Date |
Closing |
Open |
Range |
Volume |
Thu 23 October 2025 |
566.90 (5.46%) |
537.60 |
525.00 - 576.00 |
0.876 times |
Fri 17 October 2025 |
537.55 (-0.06%) |
528.05 |
491.10 - 560.00 |
1.566 times |
Fri 10 October 2025 |
537.85 (1.85%) |
538.65 |
537.85 - 570.00 |
0.6411 times |
Fri 03 October 2025 |
528.10 (4%) |
517.95 |
507.60 - 528.10 |
0.6887 times |
Fri 26 September 2025 |
507.80 (-5.9%) |
528.90 |
487.90 - 528.90 |
0.6824 times |
Fri 19 September 2025 |
539.65 (1.92%) |
540.05 |
539.65 - 573.05 |
0.7544 times |
Fri 12 September 2025 |
529.50 (10.37%) |
489.30 |
489.30 - 529.50 |
0.8672 times |
Fri 05 September 2025 |
479.75 (23.01%) |
395.95 |
391.05 - 479.75 |
1.4279 times |
Fri 29 August 2025 |
390.00 (3.16%) |
377.00 |
365.00 - 397.00 |
0.8473 times |
Fri 22 August 2025 |
378.05 (5.04%) |
359.90 |
341.95 - 391.90 |
1.649 times |
Thu 14 August 2025 |
359.90 (5.47%) |
341.25 |
325.00 - 384.40 |
2.1849 times |
Monthly price and charts Indokem Strong monthly Stock price targets for Indokem 504092 are 529 and 613.9 | Monthly Target 1 | 459.77 | | Monthly Target 2 | 513.33 | | Monthly Target 3 | 544.66666666667 | | Monthly Target 4 | 598.23 | | Monthly Target 5 | 629.57 |
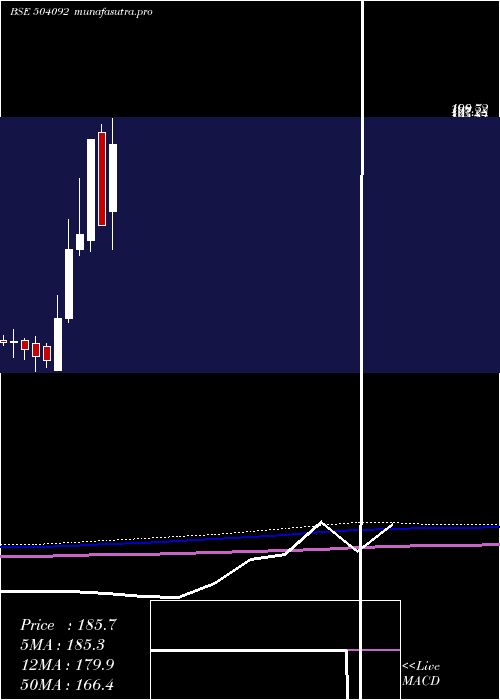
Monthly price and volumes Indokem
| Date |
Closing |
Open |
Range |
Volume |
Thu 23 October 2025 |
566.90 (11.68%) |
517.75 |
491.10 - 576.00 |
0.8363 times |
Tue 30 September 2025 |
507.60 (30.15%) |
395.95 |
391.05 - 573.05 |
1.0072 times |
Fri 29 August 2025 |
390.00 (28.65%) |
309.20 |
309.20 - 397.00 |
1.3665 times |
Thu 31 July 2025 |
303.15 (13.39%) |
270.00 |
260.00 - 342.00 |
0.6957 times |
Mon 30 June 2025 |
267.35 (43.93%) |
191.80 |
186.00 - 270.00 |
1.6264 times |
Fri 30 May 2025 |
185.75 (28.15%) |
152.00 |
133.20 - 199.00 |
0.9278 times |
Wed 30 April 2025 |
144.95 (-23.04%) |
191.90 |
144.95 - 195.90 |
0.5939 times |
Fri 28 March 2025 |
188.35 (34.15%) |
137.60 |
132.20 - 188.35 |
0.6972 times |
Fri 28 February 2025 |
140.40 (5.56%) |
133.05 |
130.00 - 168.90 |
0.9785 times |
Fri 31 January 2025 |
133.00 (35.25%) |
98.34 |
96.60 - 148.00 |
1.2705 times |
Tue 31 December 2024 |
98.34 (27.28%) |
72.50 |
72.50 - 110.00 |
0.6978 times |
DMA SMA EMA moving averages of Indokem 504092
DMA (daily moving average) of Indokem 504092
| DMA period | DMA value | | 5 day DMA | 548.05 | | 12 day DMA | 542.67 | | 20 day DMA | 531.79 | | 35 day DMA | 524.92 | | 50 day DMA | 481.01 | | 100 day DMA | 377.04 | | 150 day DMA | 308.59 | | 200 day DMA | 265.01 | EMA (exponential moving average) of Indokem 504092
| EMA period | EMA current | EMA prev | EMA prev2 | | 5 day EMA | 550.76 | 542.69 | 539.54 | | 12 day EMA | 541.7 | 537.12 | 534.96 | | 20 day EMA | 532.26 | 528.61 | 526.46 | | 35 day EMA | 502.34 | 498.54 | 495.57 | | 50 day EMA | 475.26 | 471.52 | 468.36 |
SMA (simple moving average) of Indokem 504092
| SMA period | SMA current | SMA prev | SMA prev2 | | 5 day SMA | 548.05 | 540.58 | 537.12 | | 12 day SMA | 542.67 | 540.31 | 538.57 | | 20 day SMA | 531.79 | 529.36 | 528.35 | | 35 day SMA | 524.92 | 521 | 517.02 | | 50 day SMA | 481.01 | 476.5 | 472.21 | | 100 day SMA | 377.04 | 373.28 | 369.64 | | 150 day SMA | 308.59 | 305.74 | 303 | | 200 day SMA | 265.01 | 262.7 | 260.46 |
|
|
