ForbesCo 502865 full analysis,charts,indicators,moving averages,SMA,DMA,EMA,ADX,MACD,RSIForbes Co 502865 WideScreen charts, DMA,SMA,EMA technical analysis, forecast prediction, by indicators ADX,MACD,RSI,CCI BSE stock exchange
Daily price and charts and targets ForbesCo Strong Daily Stock price targets for ForbesCo 502865 are 328.78 and 344.63 | Daily Target 1 | 324.58 | | Daily Target 2 | 332.97 | | Daily Target 3 | 340.43333333333 | | Daily Target 4 | 348.82 | | Daily Target 5 | 356.28 |
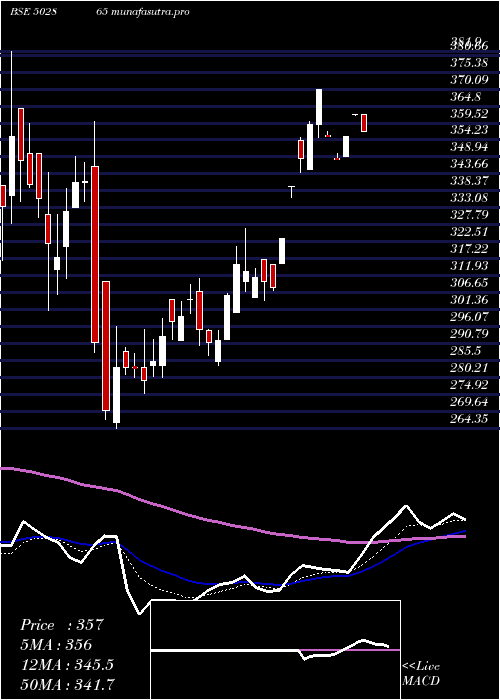
Daily price and volume Forbes Co
| Date |
Closing |
Open |
Range |
Volume |
Fri 05 December 2025 |
341.35 (0.59%) |
342.00 |
332.05 - 347.90 |
0.1228 times |
Thu 04 December 2025 |
339.35 (3.01%) |
329.45 |
326.00 - 347.85 |
0.3084 times |
Wed 03 December 2025 |
329.45 (2.89%) |
315.05 |
312.05 - 329.90 |
0.654 times |
Tue 02 December 2025 |
320.20 (-2.81%) |
325.00 |
320.00 - 328.95 |
0.5257 times |
Mon 01 December 2025 |
329.45 (-1.73%) |
339.00 |
326.00 - 348.80 |
0.8426 times |
Fri 28 November 2025 |
335.25 (-0.1%) |
348.80 |
335.00 - 348.80 |
0.5447 times |
Thu 27 November 2025 |
335.60 (-0.3%) |
338.00 |
332.05 - 340.00 |
2.2088 times |
Wed 26 November 2025 |
336.60 (-3.54%) |
348.95 |
333.00 - 350.90 |
4.042 times |
Tue 25 November 2025 |
348.95 (1.03%) |
345.40 |
340.00 - 352.00 |
0.1612 times |
Mon 24 November 2025 |
345.40 (-0.66%) |
350.00 |
342.00 - 355.00 |
0.5898 times |
Fri 21 November 2025 |
347.70 (-3.79%) |
364.00 |
345.10 - 364.00 |
1.524 times |
Weekly price and charts ForbesCo Strong weekly Stock price targets for ForbesCo 502865 are 326.7 and 363.45 | Weekly Target 1 | 297.32 | | Weekly Target 2 | 319.33 | | Weekly Target 3 | 334.06666666667 | | Weekly Target 4 | 356.08 | | Weekly Target 5 | 370.82 |
Weekly price and volumes for Forbes Co
| Date |
Closing |
Open |
Range |
Volume |
Fri 05 December 2025 |
341.35 (1.82%) |
339.00 |
312.05 - 348.80 |
0.6419 times |
Fri 28 November 2025 |
335.25 (-3.58%) |
350.00 |
332.05 - 355.00 |
1.9745 times |
Fri 21 November 2025 |
347.70 (-6.04%) |
361.70 |
345.10 - 379.90 |
0.936 times |
Fri 14 November 2025 |
370.05 (-1.16%) |
382.95 |
361.70 - 382.95 |
0.8704 times |
Fri 07 November 2025 |
374.40 (0.2%) |
376.90 |
331.05 - 384.00 |
1.0232 times |
Fri 31 October 2025 |
373.65 (2.06%) |
369.70 |
364.50 - 379.70 |
0.6072 times |
Thu 23 October 2025 |
366.10 (-0.44%) |
361.50 |
361.50 - 374.00 |
0.1955 times |
Fri 17 October 2025 |
367.70 (-0.78%) |
370.00 |
362.40 - 383.50 |
1.6891 times |
Fri 10 October 2025 |
370.60 (-0.01%) |
370.00 |
360.40 - 380.00 |
1.4182 times |
Fri 03 October 2025 |
370.65 (-0.46%) |
370.05 |
360.00 - 386.00 |
0.6439 times |
Fri 26 September 2025 |
372.35 (-7.65%) |
403.20 |
370.00 - 406.90 |
1.2961 times |

Monthly price and charts ForbesCo Strong monthly Stock price targets for ForbesCo 502865 are 326.7 and 363.45 | Monthly Target 1 | 297.32 | | Monthly Target 2 | 319.33 | | Monthly Target 3 | 334.06666666667 | | Monthly Target 4 | 356.08 | | Monthly Target 5 | 370.82 |
Monthly price and volumes Forbes Co
| Date |
Closing |
Open |
Range |
Volume |
Fri 05 December 2025 |
341.35 (1.82%) |
339.00 |
312.05 - 348.80 |
0.0553 times |
Fri 28 November 2025 |
335.25 (-10.28%) |
376.90 |
331.05 - 384.00 |
0.4142 times |
Fri 31 October 2025 |
373.65 (1.62%) |
362.50 |
360.00 - 386.00 |
0.387 times |
Tue 30 September 2025 |
367.70 (-12.86%) |
421.65 |
362.60 - 433.90 |
0.3272 times |
Fri 29 August 2025 |
421.95 (1.88%) |
414.15 |
400.10 - 449.00 |
0.4573 times |
Thu 31 July 2025 |
414.15 (-4.36%) |
437.00 |
385.00 - 477.00 |
0.8889 times |
Mon 30 June 2025 |
433.05 (11.6%) |
390.10 |
376.20 - 465.00 |
0.9959 times |
Fri 30 May 2025 |
388.05 (8.7%) |
364.10 |
343.20 - 392.50 |
0.3073 times |
Wed 30 April 2025 |
357.00 (22.34%) |
292.00 |
292.00 - 369.95 |
0.9043 times |
Fri 28 March 2025 |
291.80 (-9.38%) |
313.95 |
264.35 - 359.90 |
5.2626 times |
Fri 28 February 2025 |
322.00 (-10.54%) |
373.45 |
276.00 - 381.90 |
1.3449 times |

DMA SMA EMA moving averages of Forbes Co 502865
DMA (daily moving average) of Forbes Co 502865
| DMA period | DMA value | | 5 day DMA | 331.96 | | 12 day DMA | 339.23 | | 20 day DMA | 351.04 | | 35 day DMA | 358.69 | | 50 day DMA | 362.63 | | 100 day DMA | 392.92 | | 150 day DMA | 393.84 | | 200 day DMA | 376.05 | EMA (exponential moving average) of Forbes Co 502865
| EMA period | EMA current | EMA prev | EMA prev2 | | 5 day EMA | 336.21 | 333.64 | 330.78 | | 12 day EMA | 340.8 | 340.7 | 340.94 | | 20 day EMA | 347.15 | 347.76 | 348.64 | | 35 day EMA | 355.7 | 356.55 | 357.56 | | 50 day EMA | 363.34 | 364.24 | 365.26 |
SMA (simple moving average) of Forbes Co 502865
| SMA period | SMA current | SMA prev | SMA prev2 | | 5 day SMA | 331.96 | 330.74 | 329.99 | | 12 day SMA | 339.23 | 341.74 | 344.33 | | 20 day SMA | 351.04 | 352.36 | 353.97 | | 35 day SMA | 358.69 | 359.51 | 360.4 | | 50 day SMA | 362.63 | 363.87 | 365.18 | | 100 day SMA | 392.92 | 393.41 | 394.01 | | 150 day SMA | 393.84 | 393.93 | 393.99 | | 200 day SMA | 376.05 | 376.13 | 376.23 |
|
|
