SeshaPaper 502450 full analysis,charts,indicators,moving averages,SMA,DMA,EMA,ADX,MACD,RSISesha Paper 502450 WideScreen charts, DMA,SMA,EMA technical analysis, forecast prediction, by indicators ADX,MACD,RSI,CCI BSE stock exchange
Daily price and charts and targets SeshaPaper Strong Daily Stock price targets for SeshaPaper 502450 are 251.1 and 255.65 | Daily Target 1 | 249.98 | | Daily Target 2 | 252.22 | | Daily Target 3 | 254.53333333333 | | Daily Target 4 | 256.77 | | Daily Target 5 | 259.08 |
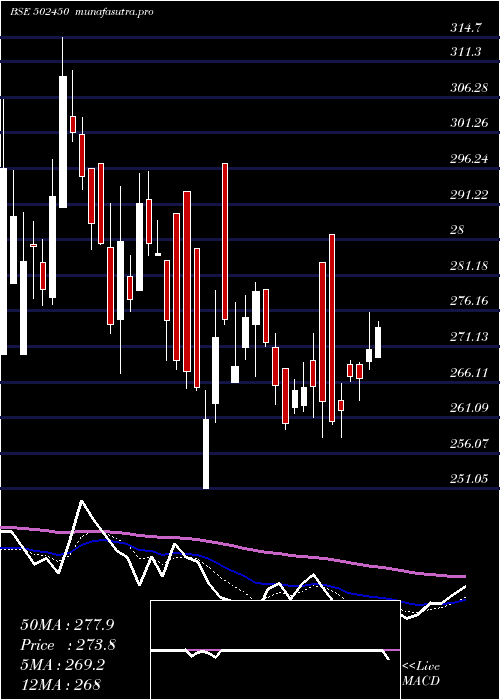
Daily price and volume Sesha Paper
| Date |
Closing |
Open |
Range |
Volume |
Thu 23 October 2025 |
254.45 (-1.17%) |
256.75 |
252.30 - 256.85 |
2.1583 times |
Tue 21 October 2025 |
257.45 (-0.25%) |
257.90 |
256.75 - 259.05 |
0.1167 times |
Mon 20 October 2025 |
258.10 (2.5%) |
253.45 |
251.80 - 258.10 |
0.2879 times |
Fri 17 October 2025 |
251.80 (-1%) |
250.55 |
250.45 - 255.10 |
1.9503 times |
Thu 16 October 2025 |
254.35 (-0.55%) |
253.95 |
251.55 - 256.50 |
0.1623 times |
Wed 15 October 2025 |
255.75 (-1.16%) |
256.00 |
254.15 - 259.15 |
0.1243 times |
Tue 14 October 2025 |
258.75 (-0.17%) |
255.00 |
250.35 - 258.75 |
3.3743 times |
Mon 13 October 2025 |
259.20 (1.19%) |
255.00 |
255.00 - 260.90 |
0.3741 times |
Fri 10 October 2025 |
256.15 (-1.27%) |
256.85 |
255.00 - 258.90 |
1.0779 times |
Thu 09 October 2025 |
259.45 (0.19%) |
259.00 |
256.80 - 260.80 |
0.3741 times |
Wed 08 October 2025 |
258.95 (-0.04%) |
261.00 |
257.40 - 261.00 |
0.7456 times |
Weekly price and charts SeshaPaper Strong weekly Stock price targets for SeshaPaper 502450 are 253.13 and 260.38 | Weekly Target 1 | 247.85 | | Weekly Target 2 | 251.15 | | Weekly Target 3 | 255.1 | | Weekly Target 4 | 258.4 | | Weekly Target 5 | 262.35 |
Weekly price and volumes for Sesha Paper
| Date |
Closing |
Open |
Range |
Volume |
Thu 23 October 2025 |
254.45 (1.05%) |
253.45 |
251.80 - 259.05 |
0.2313 times |
Fri 17 October 2025 |
251.80 (-1.7%) |
255.00 |
250.35 - 260.90 |
0.5403 times |
Fri 10 October 2025 |
256.15 (-2.64%) |
264.40 |
255.00 - 266.70 |
0.4656 times |
Fri 03 October 2025 |
263.10 (4.65%) |
252.00 |
249.65 - 265.60 |
0.5821 times |
Fri 26 September 2025 |
251.40 (-4.34%) |
264.35 |
246.30 - 266.55 |
1.441 times |
Fri 19 September 2025 |
262.80 (-1.94%) |
266.75 |
260.10 - 270.45 |
0.7618 times |
Fri 12 September 2025 |
268.00 (0.71%) |
259.15 |
259.15 - 278.00 |
0.5295 times |
Fri 05 September 2025 |
266.10 (0.15%) |
266.00 |
264.30 - 284.35 |
0.6208 times |
Fri 29 August 2025 |
265.70 (1.2%) |
266.90 |
263.25 - 285.35 |
4.1158 times |
Fri 22 August 2025 |
262.55 (-1.11%) |
266.50 |
259.20 - 279.00 |
0.7119 times |
Thu 14 August 2025 |
265.50 (-0.21%) |
262.65 |
261.60 - 275.40 |
0.3902 times |

Monthly price and charts SeshaPaper Strong monthly Stock price targets for SeshaPaper 502450 are 252.4 and 268.75 | Monthly Target 1 | 240.82 | | Monthly Target 2 | 247.63 | | Monthly Target 3 | 257.16666666667 | | Monthly Target 4 | 263.98 | | Monthly Target 5 | 273.52 |
Monthly price and volumes Sesha Paper
| Date |
Closing |
Open |
Range |
Volume |
Thu 23 October 2025 |
254.45 (1.13%) |
253.60 |
250.35 - 266.70 |
0.4071 times |
Tue 30 September 2025 |
251.60 (-5.31%) |
266.00 |
246.30 - 284.35 |
0.859 times |
Fri 29 August 2025 |
265.70 (-2.01%) |
270.10 |
259.20 - 285.35 |
1.5476 times |
Thu 31 July 2025 |
271.15 (-9.66%) |
299.15 |
270.10 - 315.20 |
1.2253 times |
Mon 30 June 2025 |
300.15 (4.58%) |
295.30 |
274.95 - 323.80 |
0.8433 times |
Fri 30 May 2025 |
287.00 (6.24%) |
270.15 |
256.45 - 307.00 |
0.9491 times |
Wed 30 April 2025 |
270.15 (3.8%) |
262.60 |
258.25 - 287.00 |
0.3588 times |
Fri 28 March 2025 |
260.25 (-5.09%) |
275.00 |
251.05 - 297.00 |
1.6657 times |
Fri 28 February 2025 |
274.20 (-6.56%) |
318.95 |
270.00 - 318.95 |
1.1304 times |
Fri 31 January 2025 |
293.45 (-4.21%) |
340.60 |
278.00 - 353.90 |
1.0136 times |
Tue 31 December 2024 |
306.35 (-0.23%) |
289.00 |
289.00 - 359.00 |
1.8642 times |

DMA SMA EMA moving averages of Sesha Paper 502450
DMA (daily moving average) of Sesha Paper 502450
| DMA period | DMA value | | 5 day DMA | 255.23 | | 12 day DMA | 256.95 | | 20 day DMA | 257.27 | | 35 day DMA | 261.54 | | 50 day DMA | 263.5 | | 100 day DMA | 276.1 | | 150 day DMA | 275.16 | | 200 day DMA | 279.69 | EMA (exponential moving average) of Sesha Paper 502450
| EMA period | EMA current | EMA prev | EMA prev2 | | 5 day EMA | 255.82 | 256.5 | 256.03 | | 12 day EMA | 256.84 | 257.28 | 257.25 | | 20 day EMA | 258.16 | 258.55 | 258.67 | | 35 day EMA | 260.42 | 260.77 | 260.97 | | 50 day EMA | 263.02 | 263.37 | 263.61 |
SMA (simple moving average) of Sesha Paper 502450
| SMA period | SMA current | SMA prev | SMA prev2 | | 5 day SMA | 255.23 | 255.49 | 255.75 | | 12 day SMA | 256.95 | 257.8 | 258.28 | | 20 day SMA | 257.27 | 257.61 | 257.87 | | 35 day SMA | 261.54 | 261.89 | 262.26 | | 50 day SMA | 263.5 | 263.74 | 263.9 | | 100 day SMA | 276.1 | 276.41 | 276.72 | | 150 day SMA | 275.16 | 275.36 | 275.59 | | 200 day SMA | 279.69 | 279.99 | 280.2 |
|
|
