MangalamCem 502157 full analysis,charts,indicators,moving averages,SMA,DMA,EMA,ADX,MACD,RSIMangalam Cem 502157 WideScreen charts, DMA,SMA,EMA technical analysis, forecast prediction, by indicators ADX,MACD,RSI,CCI BSE stock exchange
Daily price and charts and targets MangalamCem Strong Daily Stock price targets for MangalamCem 502157 are 761.33 and 771.88 | Daily Target 1 | 753.38 | | Daily Target 2 | 758.72 | | Daily Target 3 | 763.93333333333 | | Daily Target 4 | 769.27 | | Daily Target 5 | 774.48 |
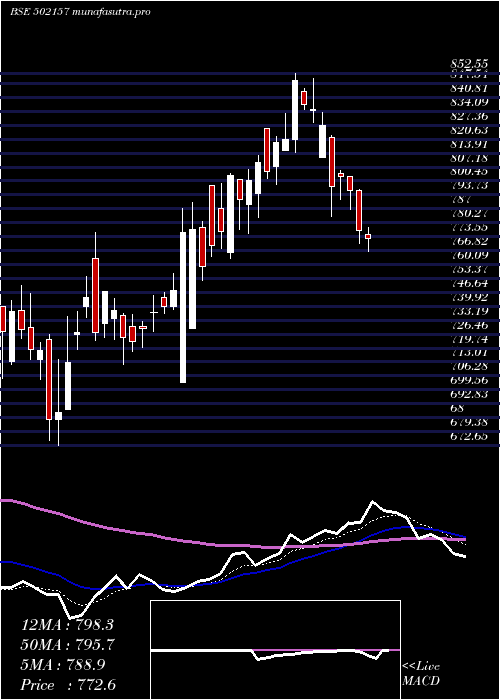
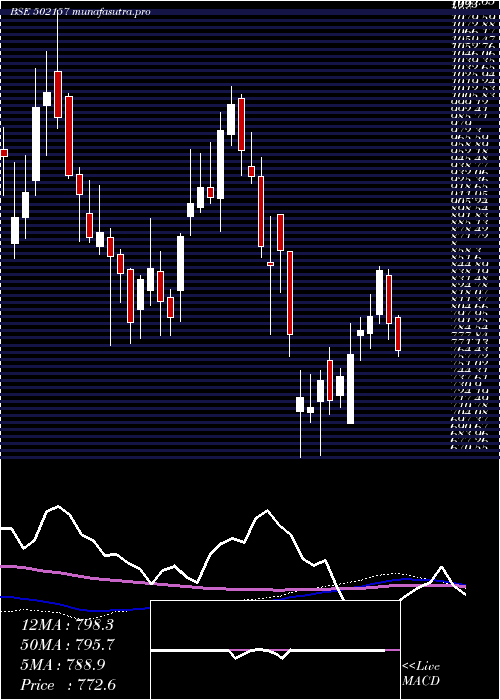
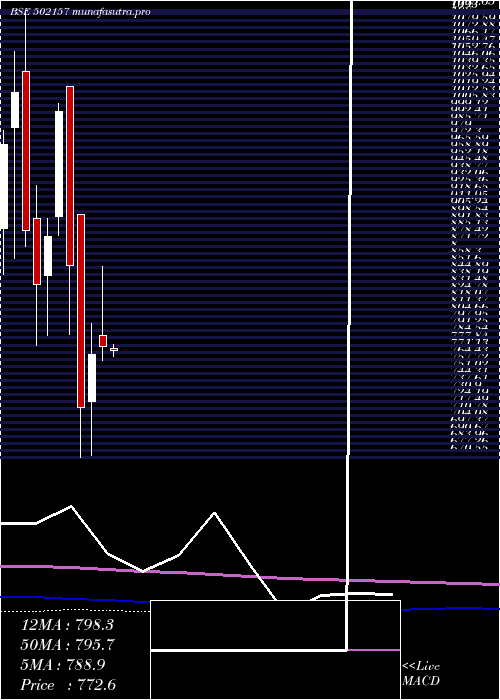
Daily price and volume Mangalam Cem
| Date |
Closing |
Open |
Range |
Volume |
Tue 21 October 2025 |
764.05 (1.91%) |
760.90 |
758.60 - 769.15 |
0.4958 times |
Mon 20 October 2025 |
749.75 (0.17%) |
750.70 |
744.60 - 753.40 |
3.0659 times |
Fri 17 October 2025 |
748.45 (-1.13%) |
753.65 |
743.95 - 770.00 |
2.8324 times |
Thu 16 October 2025 |
757.00 (1.06%) |
760.00 |
753.70 - 765.30 |
1.1331 times |
Wed 15 October 2025 |
749.05 (2.1%) |
731.30 |
726.95 - 761.50 |
0.6644 times |
Tue 14 October 2025 |
733.65 (-0.33%) |
734.60 |
728.00 - 734.60 |
0.384 times |
Mon 13 October 2025 |
736.05 (-0.31%) |
735.20 |
732.85 - 736.20 |
0.2082 times |
Fri 10 October 2025 |
738.35 (-0.02%) |
741.05 |
730.00 - 741.20 |
0.5688 times |
Thu 09 October 2025 |
738.50 (-0.11%) |
742.40 |
736.40 - 744.25 |
0.3678 times |
Wed 08 October 2025 |
739.35 (-0.45%) |
745.80 |
738.55 - 750.55 |
0.2795 times |
Tue 07 October 2025 |
742.70 (-1.81%) |
756.15 |
737.55 - 768.00 |
1.5109 times |
Weekly price and charts MangalamCem Strong weekly Stock price targets for MangalamCem 502157 are 754.33 and 778.88 | Weekly Target 1 | 734.72 | | Weekly Target 2 | 749.38 | | Weekly Target 3 | 759.26666666667 | | Weekly Target 4 | 773.93 | | Weekly Target 5 | 783.82 |
Weekly price and volumes for Mangalam Cem
| Date |
Closing |
Open |
Range |
Volume |
Tue 21 October 2025 |
764.05 (2.08%) |
750.70 |
744.60 - 769.15 |
0.3196 times |
Fri 17 October 2025 |
748.45 (1.37%) |
735.20 |
726.95 - 770.00 |
0.4685 times |
Fri 10 October 2025 |
738.35 (-2.37%) |
789.15 |
730.00 - 789.15 |
0.5319 times |
Fri 03 October 2025 |
756.30 (2.58%) |
752.05 |
740.00 - 773.40 |
0.6942 times |
Fri 26 September 2025 |
737.25 (-2.17%) |
753.00 |
727.70 - 758.40 |
0.3593 times |
Fri 19 September 2025 |
753.60 (3.81%) |
789.45 |
724.05 - 789.45 |
1.3287 times |
Fri 12 September 2025 |
725.95 (-5.38%) |
766.35 |
718.55 - 767.60 |
0.884 times |
Fri 05 September 2025 |
767.25 (9.02%) |
706.40 |
700.15 - 797.00 |
3.4567 times |
Fri 29 August 2025 |
703.80 (-3.7%) |
735.90 |
687.25 - 735.90 |
0.661 times |
Fri 22 August 2025 |
730.85 (1.88%) |
711.05 |
711.05 - 755.00 |
1.2962 times |
Thu 14 August 2025 |
717.35 (-1.97%) |
740.00 |
703.80 - 765.00 |
8.1408 times |
Monthly price and charts MangalamCem Strong monthly Stock price targets for MangalamCem 502157 are 745.5 and 807.7 | Monthly Target 1 | 697.85 | | Monthly Target 2 | 730.95 | | Monthly Target 3 | 760.05 | | Monthly Target 4 | 793.15 | | Monthly Target 5 | 822.25 |
Monthly price and volumes Mangalam Cem
| Date |
Closing |
Open |
Range |
Volume |
Tue 21 October 2025 |
764.05 (2.15%) |
746.00 |
726.95 - 789.15 |
0.2503 times |
Tue 30 September 2025 |
747.95 (6.27%) |
706.40 |
700.15 - 797.00 |
1.1318 times |
Fri 29 August 2025 |
703.80 (-1.05%) |
704.60 |
680.00 - 776.50 |
2.1341 times |
Thu 31 July 2025 |
711.30 (-4.78%) |
747.00 |
699.40 - 777.15 |
0.3811 times |
Mon 30 June 2025 |
747.00 (-7.29%) |
804.40 |
710.00 - 879.95 |
0.5605 times |
Fri 30 May 2025 |
805.75 (3.78%) |
774.40 |
713.00 - 846.90 |
0.6982 times |
Wed 30 April 2025 |
776.40 (0.95%) |
786.95 |
763.05 - 852.55 |
0.4529 times |
Fri 28 March 2025 |
769.10 (7.02%) |
724.00 |
672.65 - 798.00 |
1.8507 times |
Fri 28 February 2025 |
718.65 (-15.76%) |
901.95 |
670.55 - 901.95 |
1.4761 times |
Fri 31 January 2025 |
853.05 (-14.71%) |
1023.95 |
787.40 - 1023.95 |
1.0643 times |
Tue 31 December 2024 |
1000.15 (13.5%) |
899.95 |
882.25 - 1007.60 |
1.4382 times |
DMA SMA EMA moving averages of Mangalam Cem 502157
DMA (daily moving average) of Mangalam Cem 502157
| DMA period | DMA value | | 5 day DMA | 753.66 | | 12 day DMA | 746.11 | | 20 day DMA | 745.31 | | 35 day DMA | 745.84 | | 50 day DMA | 738.99 | | 100 day DMA | 744.88 | | 150 day DMA | 756.17 | | 200 day DMA | 781.76 | EMA (exponential moving average) of Mangalam Cem 502157
| EMA period | EMA current | EMA prev | EMA prev2 | | 5 day EMA | 753.4 | 748.08 | 747.24 | | 12 day EMA | 748.46 | 745.63 | 744.88 | | 20 day EMA | 746.04 | 744.14 | 743.55 | | 35 day EMA | 741.54 | 740.22 | 739.66 | | 50 day EMA | 738.09 | 737.03 | 736.51 |
SMA (simple moving average) of Mangalam Cem 502157
| SMA period | SMA current | SMA prev | SMA prev2 | | 5 day SMA | 753.66 | 747.58 | 744.84 | | 12 day SMA | 746.11 | 745.46 | 744.9 | | 20 day SMA | 745.31 | 744.42 | 744.62 | | 35 day SMA | 745.84 | 745.05 | 743.73 | | 50 day SMA | 738.99 | 738.08 | 737.35 | | 100 day SMA | 744.88 | 745.52 | 746.26 | | 150 day SMA | 756.17 | 755.82 | 755.42 | | 200 day SMA | 781.76 | 782.43 | 783.28 |
|
|
