ChowguleSt 501833 full analysis,charts,indicators,moving averages,SMA,DMA,EMA,ADX,MACD,RSIChowgule St 501833 WideScreen charts, DMA,SMA,EMA technical analysis, forecast prediction, by indicators ADX,MACD,RSI,CCI BSE stock exchange
Daily price and charts and targets ChowguleSt Strong Daily Stock price targets for ChowguleSt 501833 are 21.48 and 22.3 | Daily Target 1 | 20.81 | | Daily Target 2 | 21.33 | | Daily Target 3 | 21.626666666667 | | Daily Target 4 | 22.15 | | Daily Target 5 | 22.45 |
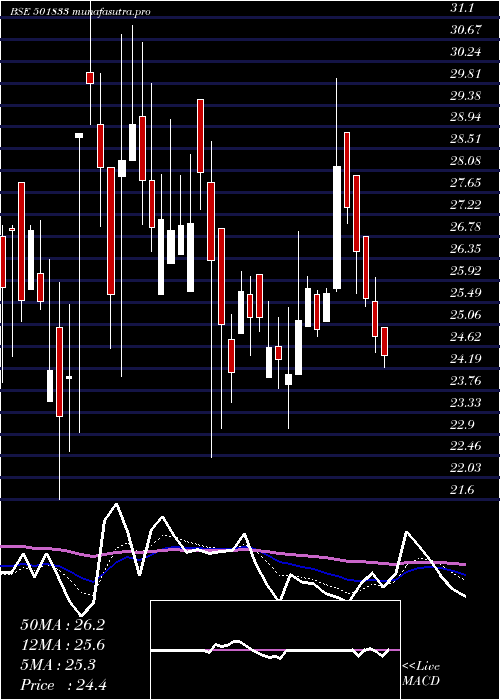
Daily price and volume Chowgule St
| Date |
Closing |
Open |
Range |
Volume |
Fri 05 December 2025 |
21.86 (0.97%) |
21.65 |
21.10 - 21.92 |
0.4887 times |
Thu 04 December 2025 |
21.65 (4.44%) |
21.10 |
21.10 - 21.90 |
0.062 times |
Wed 03 December 2025 |
20.73 (-2.45%) |
21.25 |
20.68 - 21.98 |
0.735 times |
Tue 02 December 2025 |
21.25 (-3.28%) |
22.20 |
20.66 - 22.20 |
1.3157 times |
Mon 01 December 2025 |
21.97 (-1.48%) |
22.55 |
21.60 - 22.55 |
0.7043 times |
Fri 28 November 2025 |
22.30 (4.69%) |
21.43 |
21.30 - 22.40 |
0.3318 times |
Thu 27 November 2025 |
21.30 (0.42%) |
21.47 |
20.60 - 22.62 |
0.9199 times |
Wed 26 November 2025 |
21.21 (-0.56%) |
21.10 |
21.00 - 21.88 |
2.0692 times |
Tue 25 November 2025 |
21.33 (-3%) |
21.40 |
20.50 - 22.60 |
1.2721 times |
Mon 24 November 2025 |
21.99 (-1.39%) |
22.42 |
21.00 - 22.88 |
2.1012 times |
Fri 21 November 2025 |
22.30 (-0.22%) |
22.79 |
21.52 - 22.79 |
0.1553 times |
Weekly price and charts ChowguleSt Strong weekly Stock price targets for ChowguleSt 501833 are 20.32 and 22.21 | Weekly Target 1 | 19.8 | | Weekly Target 2 | 20.83 | | Weekly Target 3 | 21.69 | | Weekly Target 4 | 22.72 | | Weekly Target 5 | 23.58 |
Weekly price and volumes for Chowgule St
| Date |
Closing |
Open |
Range |
Volume |
Fri 05 December 2025 |
21.86 (-1.97%) |
22.55 |
20.66 - 22.55 |
0.5116 times |
Fri 28 November 2025 |
22.30 (0%) |
22.42 |
20.50 - 22.88 |
1.0359 times |
Fri 21 November 2025 |
22.30 (-2.71%) |
23.20 |
21.52 - 23.94 |
0.4755 times |
Fri 14 November 2025 |
22.92 (-3.09%) |
23.85 |
22.50 - 25.00 |
1.217 times |
Fri 07 November 2025 |
23.65 (5.25%) |
22.88 |
22.58 - 24.50 |
1.8407 times |
Fri 31 October 2025 |
22.47 (0.09%) |
23.31 |
22.00 - 25.00 |
1.7161 times |
Thu 23 October 2025 |
22.45 (-0.62%) |
22.14 |
22.14 - 23.80 |
0.3674 times |
Fri 17 October 2025 |
22.59 (-0.66%) |
22.35 |
21.70 - 26.17 |
0.876 times |
Fri 10 October 2025 |
22.74 (-4.65%) |
23.02 |
21.26 - 24.55 |
0.9234 times |
Fri 03 October 2025 |
23.85 (6.81%) |
22.35 |
20.70 - 26.19 |
1.0365 times |
Fri 26 September 2025 |
22.33 (-1.19%) |
22.68 |
19.01 - 25.00 |
2.2624 times |

Monthly price and charts ChowguleSt Strong monthly Stock price targets for ChowguleSt 501833 are 20.32 and 22.21 | Monthly Target 1 | 19.8 | | Monthly Target 2 | 20.83 | | Monthly Target 3 | 21.69 | | Monthly Target 4 | 22.72 | | Monthly Target 5 | 23.58 |
Monthly price and volumes Chowgule St
| Date |
Closing |
Open |
Range |
Volume |
Fri 05 December 2025 |
21.86 (-1.97%) |
22.55 |
20.66 - 22.55 |
0.0746 times |
Fri 28 November 2025 |
22.30 (-0.76%) |
22.88 |
20.50 - 25.00 |
0.6666 times |
Fri 31 October 2025 |
22.47 (2.84%) |
22.19 |
21.26 - 26.19 |
0.6418 times |
Tue 30 September 2025 |
21.85 (-3.49%) |
23.78 |
19.01 - 25.00 |
0.7164 times |
Fri 29 August 2025 |
22.64 (-3.7%) |
23.55 |
21.80 - 25.68 |
0.4783 times |
Thu 31 July 2025 |
23.51 (-4.89%) |
24.72 |
23.26 - 26.45 |
0.8345 times |
Mon 30 June 2025 |
24.72 (-8.75%) |
26.56 |
23.99 - 28.30 |
1.3798 times |
Fri 30 May 2025 |
27.09 (10.84%) |
24.06 |
23.10 - 30.86 |
2.6272 times |
Wed 30 April 2025 |
24.44 (1.41%) |
24.87 |
23.01 - 29.90 |
0.6835 times |
Fri 28 March 2025 |
24.10 (-0.17%) |
24.99 |
21.60 - 33.85 |
1.8974 times |
Fri 28 February 2025 |
24.14 (-10.53%) |
27.94 |
22.58 - 30.50 |
0.6613 times |

DMA SMA EMA moving averages of Chowgule St 501833
DMA (daily moving average) of Chowgule St 501833
| DMA period | DMA value | | 5 day DMA | 21.49 | | 12 day DMA | 21.69 | | 20 day DMA | 22.34 | | 35 day DMA | 22.65 | | 50 day DMA | 22.73 | | 100 day DMA | 23.14 | | 150 day DMA | 23.93 | | 200 day DMA | 24.54 | EMA (exponential moving average) of Chowgule St 501833
| EMA period | EMA current | EMA prev | EMA prev2 | | 5 day EMA | 21.59 | 21.46 | 21.36 | | 12 day EMA | 21.82 | 21.81 | 21.84 | | 20 day EMA | 22.09 | 22.11 | 22.16 | | 35 day EMA | 22.35 | 22.38 | 22.42 | | 50 day EMA | 22.59 | 22.62 | 22.66 |
SMA (simple moving average) of Chowgule St 501833
| SMA period | SMA current | SMA prev | SMA prev2 | | 5 day SMA | 21.49 | 21.58 | 21.51 | | 12 day SMA | 21.69 | 21.74 | 21.85 | | 20 day SMA | 22.34 | 22.41 | 22.5 | | 35 day SMA | 22.65 | 22.66 | 22.69 | | 50 day SMA | 22.73 | 22.74 | 22.75 | | 100 day SMA | 23.14 | 23.17 | 23.21 | | 150 day SMA | 23.93 | 23.96 | 23.99 | | 200 day SMA | 24.54 | 24.56 | 24.59 |
|
|
