IndiaNiveh 501700 full analysis,charts,indicators,moving averages,SMA,DMA,EMA,ADX,MACD,RSIIndia Niveh 501700 WideScreen charts, DMA,SMA,EMA technical analysis, forecast prediction, by indicators ADX,MACD,RSI,CCI BSE stock exchange
Daily price and charts and targets IndiaNiveh Strong Daily Stock price targets for IndiaNiveh 501700 are 8.15 and 8.29 | Daily Target 1 | 8.11 | | Daily Target 2 | 8.18 | | Daily Target 3 | 8.2533333333333 | | Daily Target 4 | 8.32 | | Daily Target 5 | 8.39 |
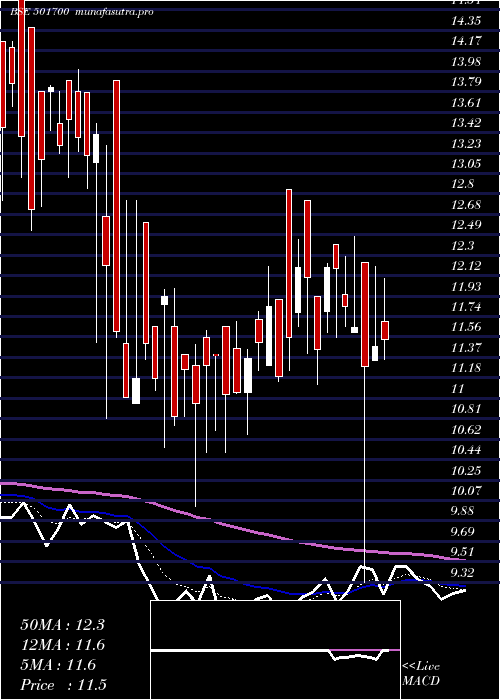
Daily price and volume India Niveh
| Date |
Closing |
Open |
Range |
Volume |
Tue 21 October 2025 |
8.24 (0.61%) |
8.33 |
8.19 - 8.33 |
0.1049 times |
Mon 20 October 2025 |
8.19 (1.99%) |
8.23 |
6.88 - 8.23 |
2.687 times |
Fri 17 October 2025 |
8.03 (0.37%) |
8.10 |
7.87 - 8.19 |
0.2641 times |
Thu 16 October 2025 |
8.00 (0%) |
8.09 |
7.98 - 8.09 |
0.2308 times |
Wed 15 October 2025 |
8.00 (-0.5%) |
8.04 |
7.66 - 8.04 |
0.0929 times |
Tue 14 October 2025 |
8.04 (4.55%) |
7.89 |
7.65 - 8.15 |
0.3576 times |
Mon 13 October 2025 |
7.69 (-4.35%) |
8.18 |
7.65 - 8.18 |
0.962 times |
Fri 10 October 2025 |
8.04 (0%) |
8.04 |
7.85 - 8.04 |
0.1688 times |
Thu 09 October 2025 |
8.04 (-3.6%) |
8.16 |
6.93 - 8.38 |
2.8323 times |
Wed 08 October 2025 |
8.34 (-2.91%) |
8.42 |
8.11 - 8.65 |
2.2994 times |
Tue 07 October 2025 |
8.59 (2.63%) |
8.40 |
8.40 - 8.67 |
0.2208 times |
Weekly price and charts IndiaNiveh Strong weekly Stock price targets for IndiaNiveh 501700 are 7.56 and 9.01 | Weekly Target 1 | 6.37 | | Weekly Target 2 | 7.3 | | Weekly Target 3 | 7.8166666666667 | | Weekly Target 4 | 8.75 | | Weekly Target 5 | 9.27 |
Weekly price and volumes for India Niveh
| Date |
Closing |
Open |
Range |
Volume |
Tue 21 October 2025 |
8.24 (2.62%) |
8.23 |
6.88 - 8.33 |
0.9927 times |
Fri 17 October 2025 |
8.03 (-0.12%) |
8.18 |
7.65 - 8.19 |
0.6782 times |
Fri 10 October 2025 |
8.04 (-9.15%) |
8.62 |
6.93 - 9.00 |
2.474 times |
Fri 03 October 2025 |
8.85 (2.08%) |
8.49 |
8.49 - 9.70 |
0.4451 times |
Fri 26 September 2025 |
8.67 (-0.12%) |
8.73 |
8.47 - 10.00 |
0.7933 times |
Fri 19 September 2025 |
8.68 (-2.25%) |
8.88 |
8.20 - 9.80 |
0.7571 times |
Fri 12 September 2025 |
8.88 (1.6%) |
8.74 |
8.11 - 9.50 |
0.9356 times |
Fri 05 September 2025 |
8.74 (-0.11%) |
8.75 |
8.00 - 9.42 |
0.903 times |
Fri 29 August 2025 |
8.75 (7.63%) |
8.29 |
7.54 - 9.49 |
1.1525 times |
Fri 22 August 2025 |
8.13 (-2.75%) |
8.57 |
8.00 - 8.91 |
0.8685 times |
Thu 14 August 2025 |
8.36 (-0.48%) |
8.45 |
8.00 - 8.62 |
0.5396 times |

Monthly price and charts IndiaNiveh Strong monthly Stock price targets for IndiaNiveh 501700 are 6.26 and 8.86 | Monthly Target 1 | 5.6 | | Monthly Target 2 | 6.92 | | Monthly Target 3 | 8.2 | | Monthly Target 4 | 9.52 | | Monthly Target 5 | 10.8 |
Monthly price and volumes India Niveh
| Date |
Closing |
Open |
Range |
Volume |
Tue 21 October 2025 |
8.24 (-3.74%) |
9.48 |
6.88 - 9.48 |
0.8475 times |
Tue 30 September 2025 |
8.56 (-2.17%) |
8.75 |
8.00 - 10.00 |
0.6758 times |
Fri 29 August 2025 |
8.75 (-1.8%) |
9.29 |
7.54 - 9.49 |
0.6875 times |
Thu 31 July 2025 |
8.91 (-8.14%) |
10.15 |
8.00 - 10.20 |
0.8022 times |
Mon 30 June 2025 |
9.70 (-13.55%) |
11.05 |
9.20 - 11.80 |
1.2181 times |
Fri 30 May 2025 |
11.22 (-1.67%) |
11.18 |
10.00 - 13.42 |
1.0687 times |
Wed 30 April 2025 |
11.41 (-1.21%) |
11.78 |
9.32 - 12.80 |
0.4933 times |
Fri 28 March 2025 |
11.55 (-5.41%) |
13.90 |
10.01 - 13.90 |
1.9804 times |
Fri 28 February 2025 |
12.21 (-13.47%) |
14.99 |
10.81 - 14.99 |
0.4677 times |
Fri 31 January 2025 |
14.11 (-2.76%) |
14.74 |
13.00 - 17.25 |
1.7589 times |
Tue 31 December 2024 |
14.51 (-5.35%) |
15.90 |
13.00 - 16.00 |
1.7491 times |

DMA SMA EMA moving averages of India Niveh 501700
DMA (daily moving average) of India Niveh 501700
| DMA period | DMA value | | 5 day DMA | 8.09 | | 12 day DMA | 8.13 | | 20 day DMA | 8.41 | | 35 day DMA | 8.54 | | 50 day DMA | 8.47 | | 100 day DMA | 9.15 | | 150 day DMA | 9.94 | | 200 day DMA | 10.95 | EMA (exponential moving average) of India Niveh 501700
| EMA period | EMA current | EMA prev | EMA prev2 | | 5 day EMA | 8.13 | 8.08 | 8.03 | | 12 day EMA | 8.2 | 8.19 | 8.19 | | 20 day EMA | 8.31 | 8.32 | 8.33 | | 35 day EMA | 8.39 | 8.4 | 8.41 | | 50 day EMA | 8.47 | 8.48 | 8.49 |
SMA (simple moving average) of India Niveh 501700
| SMA period | SMA current | SMA prev | SMA prev2 | | 5 day SMA | 8.09 | 8.05 | 7.95 | | 12 day SMA | 8.13 | 8.18 | 8.26 | | 20 day SMA | 8.41 | 8.44 | 8.46 | | 35 day SMA | 8.54 | 8.56 | 8.57 | | 50 day SMA | 8.47 | 8.48 | 8.49 | | 100 day SMA | 9.15 | 9.18 | 9.22 | | 150 day SMA | 9.94 | 9.96 | 9.97 | | 200 day SMA | 10.95 | 10.98 | 11 |
|
|
