GreavesCott 501455 full analysis,charts,indicators,moving averages,SMA,DMA,EMA,ADX,MACD,RSIGreaves Cott 501455 WideScreen charts, DMA,SMA,EMA technical analysis, forecast prediction, by indicators ADX,MACD,RSI,CCI BSE stock exchange
Daily price and charts and targets GreavesCott Strong Daily Stock price targets for GreavesCott 501455 are 205.85 and 207.8 | Daily Target 1 | 205.42 | | Daily Target 2 | 206.28 | | Daily Target 3 | 207.36666666667 | | Daily Target 4 | 208.23 | | Daily Target 5 | 209.32 |
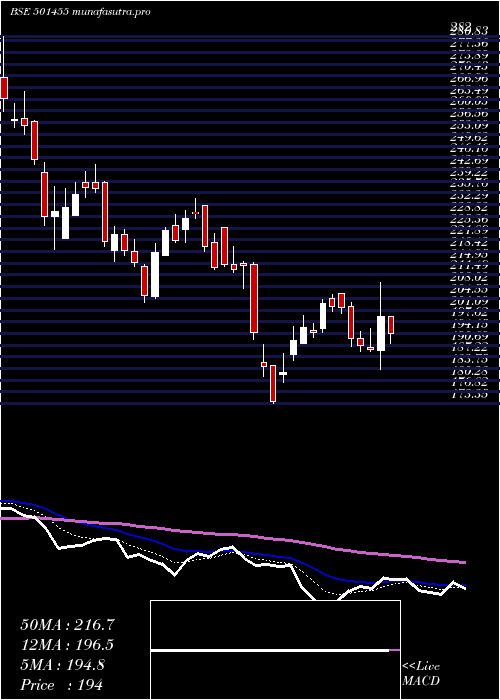
Daily price and volume Greaves Cott
| Date |
Closing |
Open |
Range |
Volume |
Tue 21 October 2025 |
207.15 (0.73%) |
208.45 |
206.50 - 208.45 |
0.1462 times |
Mon 20 October 2025 |
205.65 (0.24%) |
205.75 |
202.70 - 206.90 |
0.5416 times |
Fri 17 October 2025 |
205.15 (-0.82%) |
207.35 |
204.55 - 208.10 |
0.8934 times |
Thu 16 October 2025 |
206.85 (0.73%) |
204.15 |
204.15 - 210.35 |
2.1587 times |
Wed 15 October 2025 |
205.35 (1.94%) |
203.50 |
201.55 - 206.05 |
1.305 times |
Tue 14 October 2025 |
201.45 (-2.09%) |
206.15 |
201.00 - 206.40 |
0.9777 times |
Mon 13 October 2025 |
205.75 (-0.99%) |
207.50 |
203.85 - 207.60 |
1.5772 times |
Fri 10 October 2025 |
207.80 (-0.48%) |
207.05 |
207.05 - 210.00 |
0.8001 times |
Thu 09 October 2025 |
208.80 (0.58%) |
207.60 |
206.10 - 209.50 |
1.2668 times |
Wed 08 October 2025 |
207.60 (-1.49%) |
210.95 |
207.30 - 211.55 |
0.3333 times |
Tue 07 October 2025 |
210.75 (1.18%) |
208.75 |
208.70 - 213.70 |
1.2387 times |
Weekly price and charts GreavesCott Strong weekly Stock price targets for GreavesCott 501455 are 204.93 and 210.68 | Weekly Target 1 | 200.35 | | Weekly Target 2 | 203.75 | | Weekly Target 3 | 206.1 | | Weekly Target 4 | 209.5 | | Weekly Target 5 | 211.85 |
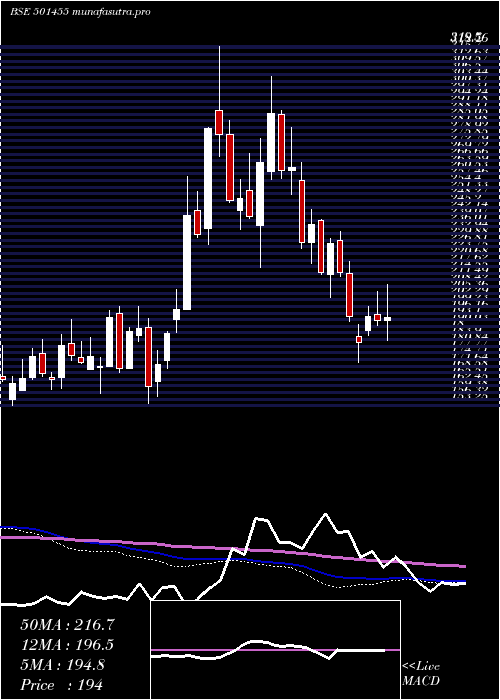
Weekly price and volumes for Greaves Cott
| Date |
Closing |
Open |
Range |
Volume |
Tue 21 October 2025 |
207.15 (0.97%) |
205.75 |
202.70 - 208.45 |
0.0606 times |
Fri 17 October 2025 |
205.15 (-1.28%) |
207.50 |
201.00 - 210.35 |
0.6086 times |
Fri 10 October 2025 |
207.80 (-4.04%) |
217.45 |
206.10 - 217.85 |
0.4124 times |
Fri 03 October 2025 |
216.55 (-0.02%) |
216.15 |
209.70 - 218.75 |
0.6583 times |
Fri 26 September 2025 |
216.60 (-1.99%) |
220.60 |
213.70 - 231.95 |
1.4709 times |
Fri 19 September 2025 |
221.00 (2.48%) |
216.00 |
214.75 - 227.80 |
1.0639 times |
Fri 12 September 2025 |
215.65 (-3.68%) |
226.05 |
212.80 - 226.05 |
0.6863 times |
Fri 05 September 2025 |
223.90 (13.05%) |
198.70 |
198.70 - 234.70 |
3.2283 times |
Fri 29 August 2025 |
198.05 (-5.06%) |
209.10 |
197.40 - 210.85 |
0.5571 times |
Fri 22 August 2025 |
208.60 (-0.22%) |
212.00 |
207.45 - 221.80 |
1.2537 times |
Thu 14 August 2025 |
209.05 (1.09%) |
208.40 |
203.40 - 219.50 |
0.8849 times |
Monthly price and charts GreavesCott Strong monthly Stock price targets for GreavesCott 501455 are 195.65 and 212.5 | Monthly Target 1 | 191.82 | | Monthly Target 2 | 199.48 | | Monthly Target 3 | 208.66666666667 | | Monthly Target 4 | 216.33 | | Monthly Target 5 | 225.52 |
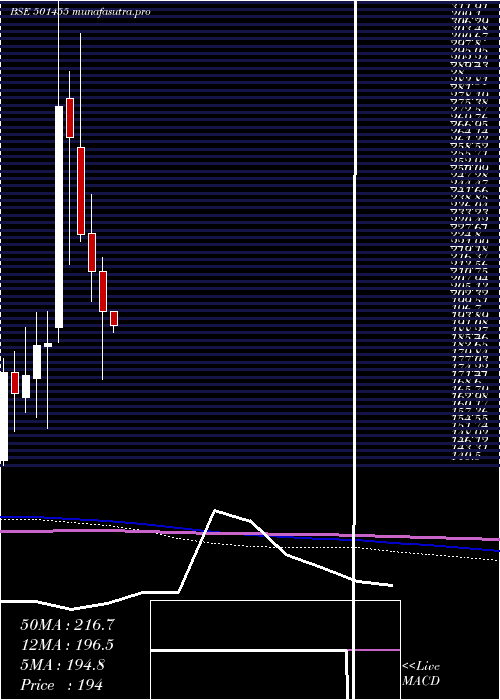
Monthly price and volumes Greaves Cott
| Date |
Closing |
Open |
Range |
Volume |
Tue 21 October 2025 |
207.15 (-2.22%) |
212.00 |
201.00 - 217.85 |
0.2217 times |
Tue 30 September 2025 |
211.85 (6.97%) |
198.70 |
198.70 - 234.70 |
1.0645 times |
Fri 29 August 2025 |
198.05 (-12.46%) |
227.05 |
197.40 - 230.70 |
0.8027 times |
Thu 31 July 2025 |
226.25 (10.91%) |
202.95 |
194.20 - 244.55 |
1.6949 times |
Mon 30 June 2025 |
204.00 (2.26%) |
199.55 |
191.90 - 217.15 |
0.5228 times |
Fri 30 May 2025 |
199.50 (0.1%) |
199.25 |
180.20 - 219.30 |
0.6649 times |
Wed 30 April 2025 |
199.30 (-7.17%) |
214.65 |
173.35 - 220.00 |
0.7282 times |
Fri 28 March 2025 |
214.70 (-6.1%) |
228.90 |
203.15 - 244.10 |
0.7558 times |
Fri 28 February 2025 |
228.65 (-13.94%) |
261.85 |
226.10 - 305.50 |
1.588 times |
Fri 31 January 2025 |
265.70 (-4.27%) |
280.80 |
217.10 - 290.95 |
1.9566 times |
Tue 31 December 2024 |
277.55 (48.54%) |
193.00 |
187.30 - 319.50 |
4.766 times |
DMA SMA EMA moving averages of Greaves Cott 501455
DMA (daily moving average) of Greaves Cott 501455
| DMA period | DMA value | | 5 day DMA | 206.03 | | 12 day DMA | 206.72 | | 20 day DMA | 211.17 | | 35 day DMA | 215.35 | | 50 day DMA | 213.29 | | 100 day DMA | 209.11 | | 150 day DMA | 208.2 | | 200 day DMA | 221.54 | EMA (exponential moving average) of Greaves Cott 501455
| EMA period | EMA current | EMA prev | EMA prev2 | | 5 day EMA | 206.21 | 205.74 | 205.79 | | 12 day EMA | 207.73 | 207.84 | 208.24 | | 20 day EMA | 209.75 | 210.02 | 210.48 | | 35 day EMA | 210.97 | 211.2 | 211.53 | | 50 day EMA | 212.42 | 212.64 | 212.93 |
SMA (simple moving average) of Greaves Cott 501455
| SMA period | SMA current | SMA prev | SMA prev2 | | 5 day SMA | 206.03 | 204.89 | 204.91 | | 12 day SMA | 206.72 | 207.5 | 208.32 | | 20 day SMA | 211.17 | 211.75 | 212.51 | | 35 day SMA | 215.35 | 215.29 | 215.07 | | 50 day SMA | 213.29 | 213.33 | 213.35 | | 100 day SMA | 209.11 | 209.08 | 209.08 | | 150 day SMA | 208.2 | 208.39 | 208.56 | | 200 day SMA | 221.54 | 221.65 | 221.78 |
|
|
