BomBurmah 501425 full analysis,charts,indicators,moving averages,SMA,DMA,EMA,ADX,MACD,RSIBom Burmah 501425 WideScreen charts, DMA,SMA,EMA technical analysis, forecast prediction, by indicators ADX,MACD,RSI,CCI BSE stock exchange
Daily price and charts and targets BomBurmah Strong Daily Stock price targets for BomBurmah 501425 are 2047.78 and 2091.08 | Daily Target 1 | 2015.82 | | Daily Target 2 | 2036.43 | | Daily Target 3 | 2059.1166666667 | | Daily Target 4 | 2079.73 | | Daily Target 5 | 2102.42 |
Daily price and volume Bom Burmah
| Date |
Closing |
Open |
Range |
Volume |
Tue 21 October 2025 |
2057.05 (0.51%) |
2040.05 |
2038.50 - 2081.80 |
0.2083 times |
Mon 20 October 2025 |
2046.65 (2.35%) |
1989.75 |
1988.65 - 2053.35 |
0.6209 times |
Fri 17 October 2025 |
1999.65 (5.98%) |
1898.00 |
1898.00 - 2089.95 |
8.476 times |
Thu 16 October 2025 |
1886.90 (-0.9%) |
1903.30 |
1880.00 - 1906.90 |
0.0605 times |
Wed 15 October 2025 |
1904.05 (-0.32%) |
1885.35 |
1865.00 - 1920.95 |
0.1052 times |
Tue 14 October 2025 |
1910.10 (0.94%) |
1887.00 |
1879.75 - 1929.95 |
0.1904 times |
Mon 13 October 2025 |
1892.25 (0.71%) |
1878.95 |
1849.90 - 1896.70 |
0.0623 times |
Fri 10 October 2025 |
1878.95 (1.85%) |
1835.05 |
1835.05 - 1896.45 |
0.0943 times |
Thu 09 October 2025 |
1844.90 (0%) |
1847.95 |
1830.80 - 1860.75 |
0.0713 times |
Wed 08 October 2025 |
1844.90 (-1.96%) |
1881.75 |
1840.00 - 1885.00 |
0.1107 times |
Tue 07 October 2025 |
1881.75 (-1.67%) |
1912.05 |
1873.45 - 1917.65 |
0.1219 times |
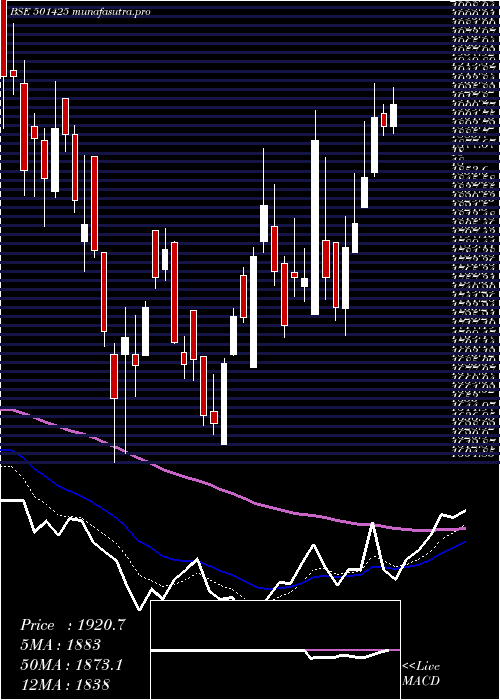
Weekly price and charts BomBurmah Strong weekly Stock price targets for BomBurmah 501425 are 2022.85 and 2116 | Weekly Target 1 | 1949.35 | | Weekly Target 2 | 2003.2 | | Weekly Target 3 | 2042.5 | | Weekly Target 4 | 2096.35 | | Weekly Target 5 | 2135.65 |
Weekly price and volumes for Bom Burmah
| Date |
Closing |
Open |
Range |
Volume |
Tue 21 October 2025 |
2057.05 (2.87%) |
1989.75 |
1988.65 - 2081.80 |
0.5298 times |
Fri 17 October 2025 |
1999.65 (6.42%) |
1878.95 |
1849.90 - 2089.95 |
5.6829 times |
Fri 10 October 2025 |
1878.95 (2.22%) |
1859.00 |
1830.80 - 1985.00 |
1.0227 times |
Fri 03 October 2025 |
1838.20 (2.95%) |
1792.00 |
1745.00 - 1842.50 |
0.3177 times |
Fri 26 September 2025 |
1785.55 (-7.77%) |
1956.35 |
1777.00 - 1956.35 |
0.3423 times |
Fri 19 September 2025 |
1936.00 (3.12%) |
1876.95 |
1875.05 - 1993.25 |
0.4998 times |
Fri 12 September 2025 |
1877.40 (1.33%) |
1851.00 |
1837.25 - 1917.00 |
0.416 times |
Fri 05 September 2025 |
1852.80 (5.58%) |
1756.25 |
1752.65 - 1918.00 |
0.5632 times |
Fri 29 August 2025 |
1754.85 (-3.82%) |
1830.05 |
1745.00 - 1851.10 |
0.3989 times |
Fri 22 August 2025 |
1824.50 (-0.34%) |
1843.00 |
1821.35 - 1879.95 |
0.2268 times |
Thu 14 August 2025 |
1830.75 (-0.52%) |
1824.00 |
1824.00 - 1896.40 |
0.2646 times |
Monthly price and charts BomBurmah Strong monthly Stock price targets for BomBurmah 501425 are 1910.6 and 2236.4 | Monthly Target 1 | 1644.58 | | Monthly Target 2 | 1850.82 | | Monthly Target 3 | 1970.3833333333 | | Monthly Target 4 | 2176.62 | | Monthly Target 5 | 2296.18 |
Monthly price and volumes Bom Burmah
| Date |
Closing |
Open |
Range |
Volume |
Tue 21 October 2025 |
2057.05 (15.99%) |
1790.00 |
1764.15 - 2089.95 |
2.2092 times |
Tue 30 September 2025 |
1773.40 (1.06%) |
1756.25 |
1745.00 - 1993.25 |
0.5934 times |
Fri 29 August 2025 |
1754.85 (-7.42%) |
1901.00 |
1745.00 - 1944.00 |
0.3526 times |
Thu 31 July 2025 |
1895.40 (-5.59%) |
2026.85 |
1822.20 - 2071.50 |
0.8829 times |
Mon 30 June 2025 |
2007.55 (-0.63%) |
2021.95 |
1806.30 - 2156.10 |
0.8504 times |
Fri 30 May 2025 |
2020.25 (8.37%) |
1860.95 |
1652.25 - 2093.65 |
0.9073 times |
Wed 30 April 2025 |
1864.30 (5.47%) |
1760.00 |
1716.85 - 2010.00 |
0.5812 times |
Fri 28 March 2025 |
1767.55 (6.39%) |
1699.85 |
1612.85 - 1881.65 |
0.7656 times |
Fri 28 February 2025 |
1661.45 (-21.51%) |
2052.05 |
1604.85 - 2222.60 |
1.0591 times |
Fri 31 January 2025 |
2116.80 (-0.08%) |
2090.05 |
1932.80 - 2345.00 |
1.7984 times |
Tue 31 December 2024 |
2118.55 (-11.92%) |
2422.60 |
2011.80 - 2488.45 |
1.0335 times |
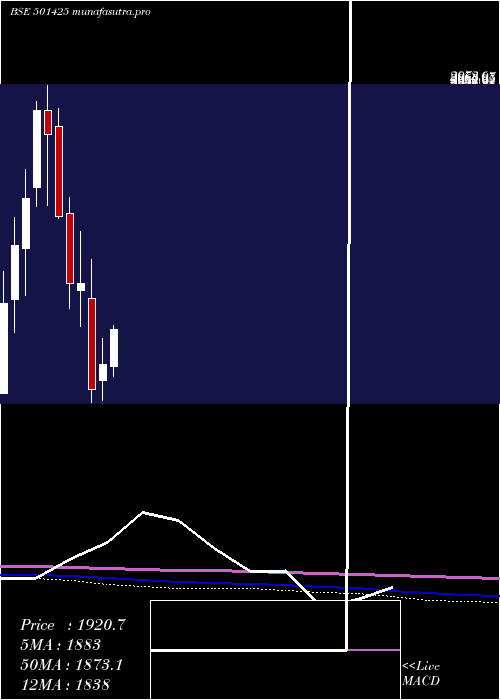
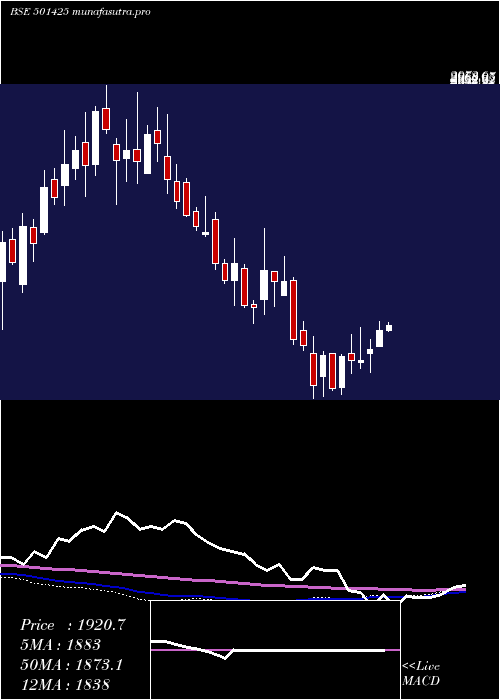
DMA SMA EMA moving averages of Bom Burmah 501425
DMA (daily moving average) of Bom Burmah 501425
| DMA period | DMA value | | 5 day DMA | 1978.86 | | 12 day DMA | 1921.74 | | 20 day DMA | 1881.97 | | 35 day DMA | 1887.69 | | 50 day DMA | 1869.12 | | 100 day DMA | 1914.3 | | 150 day DMA | 1888.39 | | 200 day DMA | 1919.95 | EMA (exponential moving average) of Bom Burmah 501425
| EMA period | EMA current | EMA prev | EMA prev2 | | 5 day EMA | 1996.58 | 1966.35 | 1926.21 | | 12 day EMA | 1940.08 | 1918.82 | 1895.59 | | 20 day EMA | 1914.65 | 1899.67 | 1884.21 | | 35 day EMA | 1889.53 | 1879.67 | 1869.84 | | 50 day EMA | 1881.25 | 1874.08 | 1867.04 |
SMA (simple moving average) of Bom Burmah 501425
| SMA period | SMA current | SMA prev | SMA prev2 | | 5 day SMA | 1978.86 | 1949.47 | 1918.59 | | 12 day SMA | 1921.74 | 1903.5 | 1883.18 | | 20 day SMA | 1881.97 | 1874.6 | 1869.07 | | 35 day SMA | 1887.69 | 1879.97 | 1871.64 | | 50 day SMA | 1869.12 | 1865.55 | 1861.46 | | 100 day SMA | 1914.3 | 1914.01 | 1913.54 | | 150 day SMA | 1888.39 | 1886.28 | 1883.91 | | 200 day SMA | 1919.95 | 1920.3 | 1921.03 |
|
|
