ShaEng 501423 full analysis,charts,indicators,moving averages,SMA,DMA,EMA,ADX,MACD,RSISha Eng 501423 WideScreen charts, DMA,SMA,EMA technical analysis, forecast prediction, by indicators ADX,MACD,RSI,CCI BSE stock exchange
Daily price and charts and targets ShaEng Strong Daily Stock price targets for ShaEng 501423 are 2444.25 and 2516.3 | Daily Target 1 | 2385.48 | | Daily Target 2 | 2430.97 | | Daily Target 3 | 2457.5333333333 | | Daily Target 4 | 2503.02 | | Daily Target 5 | 2529.58 |
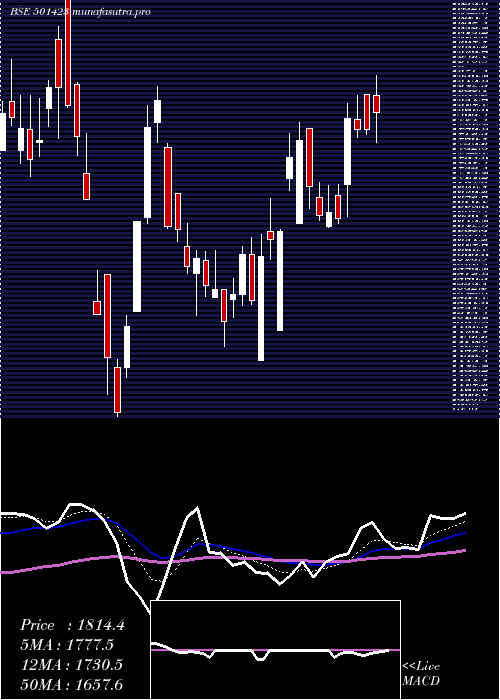
Daily price and volume Sha Eng
| Date |
Closing |
Open |
Range |
Volume |
Tue 21 October 2025 |
2476.45 (2.84%) |
2412.05 |
2412.05 - 2484.10 |
0.5189 times |
Mon 20 October 2025 |
2408.00 (0.88%) |
2388.00 |
2359.60 - 2438.00 |
0.6402 times |
Fri 17 October 2025 |
2386.95 (2.88%) |
2320.35 |
2314.45 - 2410.40 |
0.5406 times |
Thu 16 October 2025 |
2320.20 (-1.14%) |
2357.60 |
2302.35 - 2357.60 |
0.3219 times |
Wed 15 October 2025 |
2347.00 (0.4%) |
2389.75 |
2295.90 - 2389.75 |
0.4236 times |
Tue 14 October 2025 |
2337.60 (-3.56%) |
2408.05 |
2312.00 - 2437.85 |
1.5294 times |
Mon 13 October 2025 |
2423.85 (-0.33%) |
2430.05 |
2401.25 - 2446.00 |
1.2787 times |
Fri 10 October 2025 |
2431.85 (3.12%) |
2346.55 |
2346.55 - 2469.20 |
1.2491 times |
Thu 09 October 2025 |
2358.35 (0.16%) |
2354.05 |
2318.80 - 2361.30 |
1.1075 times |
Wed 08 October 2025 |
2354.70 (-2.22%) |
2440.00 |
2336.50 - 2440.00 |
2.39 times |
Tue 07 October 2025 |
2408.15 (11.91%) |
2235.05 |
2235.05 - 2449.80 |
215.1108 times |
Weekly price and charts ShaEng Strong weekly Stock price targets for ShaEng 501423 are 2418.03 and 2542.53 | Weekly Target 1 | 2315.55 | | Weekly Target 2 | 2396 | | Weekly Target 3 | 2440.05 | | Weekly Target 4 | 2520.5 | | Weekly Target 5 | 2564.55 |
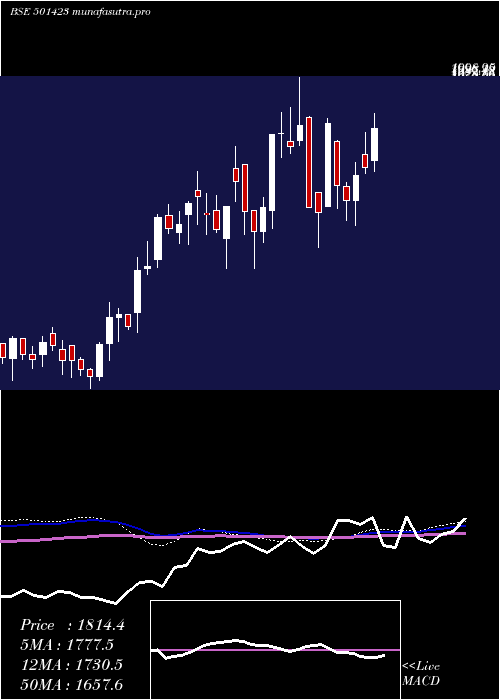
Weekly price and volumes for Sha Eng
| Date |
Closing |
Open |
Range |
Volume |
Tue 21 October 2025 |
2476.45 (3.75%) |
2388.00 |
2359.60 - 2484.10 |
0.0401 times |
Fri 17 October 2025 |
2386.95 (-1.85%) |
2430.05 |
2295.90 - 2446.00 |
0.1416 times |
Fri 10 October 2025 |
2431.85 (11.38%) |
2174.50 |
2114.00 - 2469.20 |
7.6846 times |
Fri 03 October 2025 |
2183.35 (-2.82%) |
2245.00 |
2112.00 - 2299.95 |
0.13 times |
Fri 26 September 2025 |
2246.70 (-4.53%) |
2353.85 |
2223.00 - 2376.85 |
0.2251 times |
Fri 19 September 2025 |
2353.30 (4.79%) |
2250.50 |
2202.00 - 2664.25 |
0.5217 times |
Fri 12 September 2025 |
2245.70 (2.17%) |
2195.15 |
2183.20 - 2324.90 |
0.2697 times |
Fri 05 September 2025 |
2197.95 (-1.5%) |
2243.85 |
2145.00 - 2281.00 |
0.2494 times |
Fri 29 August 2025 |
2231.40 (5.83%) |
2100.10 |
2086.40 - 2249.00 |
0.3356 times |
Fri 22 August 2025 |
2108.40 (15.04%) |
1833.20 |
1780.00 - 2127.05 |
0.4023 times |
Thu 14 August 2025 |
1832.75 (14.55%) |
1655.00 |
1609.45 - 1898.90 |
0.8284 times |
Monthly price and charts ShaEng Strong monthly Stock price targets for ShaEng 501423 are 2294.23 and 2666.33 | Monthly Target 1 | 1985.42 | | Monthly Target 2 | 2230.93 | | Monthly Target 3 | 2357.5166666667 | | Monthly Target 4 | 2603.03 | | Monthly Target 5 | 2729.62 |
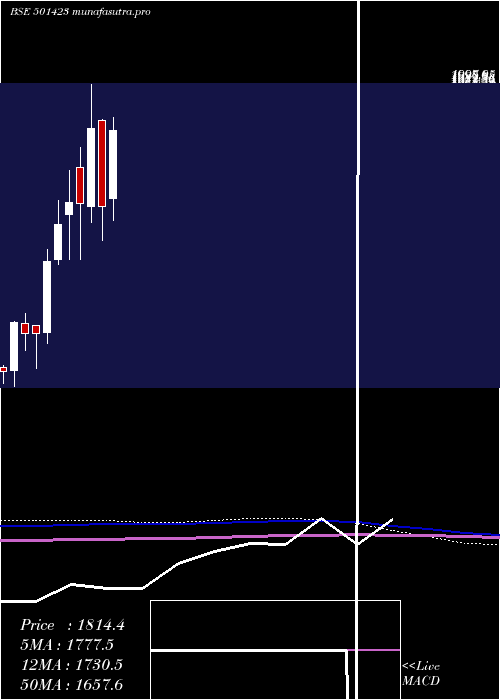
Monthly price and volumes Sha Eng
| Date |
Closing |
Open |
Range |
Volume |
Tue 21 October 2025 |
2476.45 (13.78%) |
2180.05 |
2112.00 - 2484.10 |
4.8053 times |
Tue 30 September 2025 |
2176.55 (-2.46%) |
2243.85 |
2145.00 - 2664.25 |
0.8235 times |
Fri 29 August 2025 |
2231.40 (40.73%) |
1590.05 |
1534.25 - 2249.00 |
1.0409 times |
Thu 31 July 2025 |
1585.60 (-4.63%) |
1663.00 |
1540.70 - 1969.00 |
0.2765 times |
Mon 30 June 2025 |
1662.50 (-17.61%) |
2030.05 |
1611.05 - 2070.95 |
0.4047 times |
Fri 30 May 2025 |
2017.85 (33.09%) |
1546.70 |
1460.05 - 2023.90 |
0.6933 times |
Wed 30 April 2025 |
1516.15 (-16.91%) |
1854.95 |
1380.00 - 1858.00 |
0.6412 times |
Fri 28 March 2025 |
1824.65 (19.57%) |
1515.00 |
1449.75 - 1998.95 |
0.2125 times |
Fri 28 February 2025 |
1526.05 (-0.41%) |
1670.00 |
1304.65 - 1750.00 |
0.1998 times |
Fri 31 January 2025 |
1532.30 (6.03%) |
1484.95 |
1306.00 - 1659.00 |
0.9024 times |
Tue 31 December 2024 |
1445.15 (11.35%) |
1305.00 |
1284.00 - 1538.30 |
2.6801 times |
DMA SMA EMA moving averages of Sha Eng 501423
DMA (daily moving average) of Sha Eng 501423
| DMA period | DMA value | | 5 day DMA | 2387.72 | | 12 day DMA | 2367.08 | | 20 day DMA | 2315.52 | | 35 day DMA | 2302.39 | | 50 day DMA | 2197.31 | | 100 day DMA | 1945.71 | | 150 day DMA | 1866.22 | | 200 day DMA | 1777.78 | EMA (exponential moving average) of Sha Eng 501423
| EMA period | EMA current | EMA prev | EMA prev2 | | 5 day EMA | 2409.23 | 2375.63 | 2359.45 | | 12 day EMA | 2368.26 | 2348.6 | 2337.8 | | 20 day EMA | 2332.35 | 2317.19 | 2307.63 | | 35 day EMA | 2244.86 | 2231.23 | 2220.82 | | 50 day EMA | 2170.69 | 2158.21 | 2148.02 |
SMA (simple moving average) of Sha Eng 501423
| SMA period | SMA current | SMA prev | SMA prev2 | | 5 day SMA | 2387.72 | 2359.95 | 2363.12 | | 12 day SMA | 2367.08 | 2342.65 | 2325.13 | | 20 day SMA | 2315.52 | 2307.16 | 2304.42 | | 35 day SMA | 2302.39 | 2293.62 | 2288.57 | | 50 day SMA | 2197.31 | 2179.56 | 2164.5 | | 100 day SMA | 1945.71 | 1939.46 | 1933.41 | | 150 day SMA | 1866.22 | 1860.7 | 1855.12 | | 200 day SMA | 1777.78 | 1772.43 | 1767.64 |
|
|
