TataInvest 501301 full analysis,charts,indicators,moving averages,SMA,DMA,EMA,ADX,MACD,RSITata Invest 501301 WideScreen charts, DMA,SMA,EMA technical analysis, forecast prediction, by indicators ADX,MACD,RSI,CCI BSE stock exchange
Daily price and charts and targets TataInvest Strong Daily Stock price targets for TataInvest 501301 are 788.7 and 861.2 | Daily Target 1 | 775.8 | | Daily Target 2 | 801.6 | | Daily Target 3 | 848.3 | | Daily Target 4 | 874.1 | | Daily Target 5 | 920.8 |
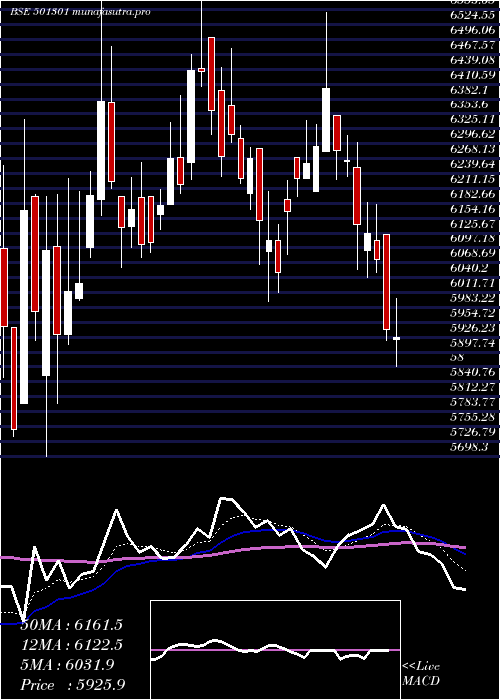
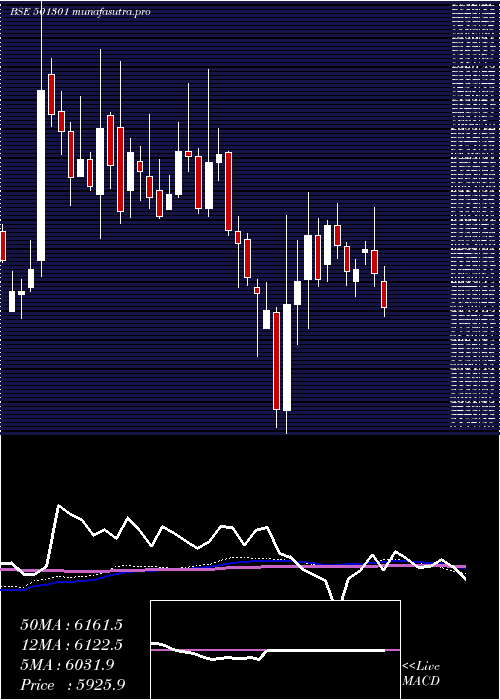
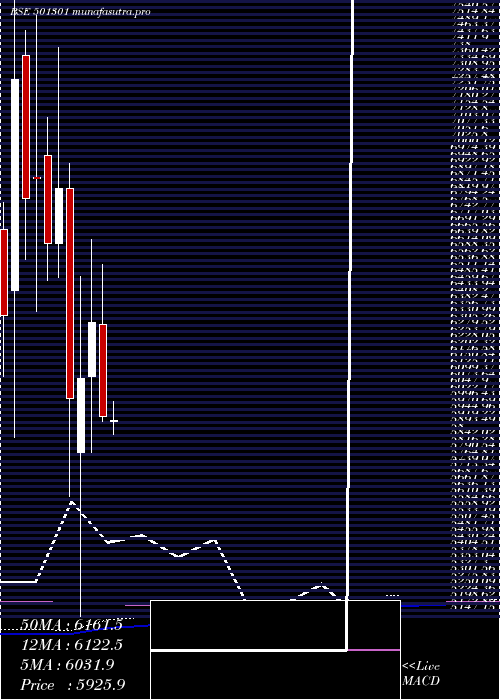
Daily price and volume Tata Invest
| Date |
Closing |
Open |
Range |
Volume |
Thu 23 October 2025 |
827.40 (-5.47%) |
893.00 |
822.50 - 895.00 |
1.9639 times |
Tue 21 October 2025 |
875.25 (8.86%) |
811.00 |
811.00 - 884.00 |
1.7595 times |
Mon 20 October 2025 |
804.05 (-9.64%) |
896.00 |
800.00 - 897.65 |
1.3622 times |
Fri 17 October 2025 |
889.85 (-1.94%) |
921.60 |
885.00 - 925.00 |
0.5792 times |
Thu 16 October 2025 |
907.45 (-3.65%) |
949.40 |
902.00 - 953.00 |
0.7438 times |
Wed 15 October 2025 |
941.80 (-8.98%) |
1014.90 |
932.00 - 1014.90 |
1.1656 times |
Tue 14 October 2025 |
1034.70 (-89.57%) |
1041.00 |
1006.90 - 1080.00 |
1.8304 times |
Mon 13 October 2025 |
9917.40 (6.63%) |
9319.95 |
9165.60 - 10008.00 |
0.2813 times |
Fri 10 October 2025 |
9300.65 (3.15%) |
9020.20 |
8888.00 - 9444.90 |
0.1745 times |
Thu 09 October 2025 |
9016.25 (-2.56%) |
9400.00 |
8915.75 - 9452.00 |
0.1395 times |
Wed 08 October 2025 |
9252.90 (0.51%) |
9251.05 |
9144.80 - 9649.00 |
0.2475 times |
Weekly price and charts TataInvest Strong weekly Stock price targets for TataInvest 501301 are 764.88 and 862.53 | Weekly Target 1 | 744.03 | | Weekly Target 2 | 785.72 | | Weekly Target 3 | 841.68333333333 | | Weekly Target 4 | 883.37 | | Weekly Target 5 | 939.33 |
Weekly price and volumes for Tata Invest
| Date |
Closing |
Open |
Range |
Volume |
Thu 23 October 2025 |
827.40 (-7.02%) |
896.00 |
800.00 - 897.65 |
3.9123 times |
Fri 17 October 2025 |
889.85 (-90.43%) |
9319.95 |
885.00 - 10008.00 |
3.539 times |
Fri 10 October 2025 |
9300.65 (-7.13%) |
10400.00 |
8888.00 - 10741.50 |
0.8386 times |
Fri 03 October 2025 |
10014.75 (15.61%) |
8889.95 |
8586.95 - 11840.00 |
1.1741 times |
Fri 26 September 2025 |
8662.30 (18.08%) |
7320.55 |
7201.00 - 9100.00 |
0.4584 times |
Fri 19 September 2025 |
7336.15 (6.8%) |
6851.55 |
6851.55 - 7550.00 |
0.0425 times |
Fri 12 September 2025 |
6869.20 (1.65%) |
6760.00 |
6660.00 - 6983.60 |
0.0122 times |
Fri 05 September 2025 |
6757.40 (-0.81%) |
7019.15 |
6715.00 - 7019.15 |
0.0072 times |
Fri 29 August 2025 |
6812.75 (-1.45%) |
6967.95 |
6790.00 - 7045.45 |
0.0078 times |
Fri 22 August 2025 |
6912.75 (0.42%) |
6927.00 |
6868.00 - 7022.45 |
0.0079 times |
Thu 14 August 2025 |
6883.55 (-0.19%) |
6891.55 |
6842.05 - 6990.20 |
0.011 times |
Monthly price and charts TataInvest Strong monthly Stock price targets for TataInvest 501301 are -4706.3 and 6333.7 | Monthly Target 1 | -6550.87 | | Monthly Target 2 | -2861.73 | | Monthly Target 3 | 4489.1333333333 | | Monthly Target 4 | 8178.27 | | Monthly Target 5 | 15529.13 |
Monthly price and volumes Tata Invest
| Date |
Closing |
Open |
Range |
Volume |
Thu 23 October 2025 |
827.40 (-92.05%) |
10615.50 |
800.00 - 11840.00 |
8.4188 times |
Tue 30 September 2025 |
10403.55 (52.71%) |
7019.15 |
6660.00 - 10606.10 |
0.9332 times |
Fri 29 August 2025 |
6812.75 (0.1%) |
6900.00 |
6750.00 - 7625.00 |
0.1262 times |
Thu 31 July 2025 |
6806.10 (-0.8%) |
6917.70 |
6475.10 - 6964.45 |
0.0527 times |
Mon 30 June 2025 |
6860.70 (2.04%) |
6729.00 |
6410.00 - 7425.95 |
0.1007 times |
Fri 30 May 2025 |
6723.40 (13.16%) |
5922.55 |
5740.00 - 6929.95 |
0.0647 times |
Wed 30 April 2025 |
5941.40 (-5.92%) |
6306.90 |
5920.05 - 6547.40 |
0.0358 times |
Fri 28 March 2025 |
6315.05 (3.64%) |
6100.05 |
5800.00 - 6644.75 |
0.0795 times |
Fri 28 February 2025 |
6093.15 (1.3%) |
5800.15 |
5147.15 - 6500.00 |
0.127 times |
Fri 31 January 2025 |
6014.70 (-12.16%) |
6850.00 |
5623.60 - 6949.00 |
0.0614 times |
Tue 31 December 2024 |
6847.35 (3.29%) |
6629.35 |
6495.00 - 7407.00 |
0.1606 times |
DMA SMA EMA moving averages of Tata Invest 501301
DMA (daily moving average) of Tata Invest 501301
| DMA period | DMA value | | 5 day DMA | 860.8 | | 12 day DMA | 4414.5 | | 20 day DMA | 6431.59 | | 35 day DMA | 6687.97 | | 50 day DMA | 6748.12 | | 100 day DMA | 6753.23 | | 150 day DMA | 6563.27 | | 200 day DMA | 6454 | EMA (exponential moving average) of Tata Invest 501301
| EMA period | EMA current | EMA prev | EMA prev2 | | 5 day EMA | 1366.05 | 1635.34 | 2015.33 | | 12 day EMA | 3476.04 | 3957.44 | 4517.64 | | 20 day EMA | 4830.58 | 5251.78 | 5712.26 | | 35 day EMA | 5834.97 | 6129.78 | 6439.13 | | 50 day EMA | 6183.74 | 6402.28 | 6627.78 |
SMA (simple moving average) of Tata Invest 501301
| SMA period | SMA current | SMA prev | SMA prev2 | | 5 day SMA | 860.8 | 883.68 | 915.57 | | 12 day SMA | 4414.5 | 5174.59 | 5936.21 | | 20 day SMA | 6431.59 | 6797.45 | 7117.66 | | 35 day SMA | 6687.97 | 6859.57 | 7029.31 | | 50 day SMA | 6748.12 | 6869.5 | 6990.11 | | 100 day SMA | 6753.23 | 6810.36 | 6865.71 | | 150 day SMA | 6563.27 | 6599.07 | 6633.43 | | 200 day SMA | 6454 | 6483.85 | 6512.14 |
|
|
