TciFinance 501242 full analysis,charts,indicators,moving averages,SMA,DMA,EMA,ADX,MACD,RSITci Finance 501242 WideScreen charts, DMA,SMA,EMA technical analysis, forecast prediction, by indicators ADX,MACD,RSI,CCI BSE stock exchange
Daily price and charts and targets TciFinance Strong Daily Stock price targets for TciFinance 501242 are 11.52 and 13.27 | Daily Target 1 | 10.18 | | Daily Target 2 | 11.1 | | Daily Target 3 | 11.933333333333 | | Daily Target 4 | 12.85 | | Daily Target 5 | 13.68 |
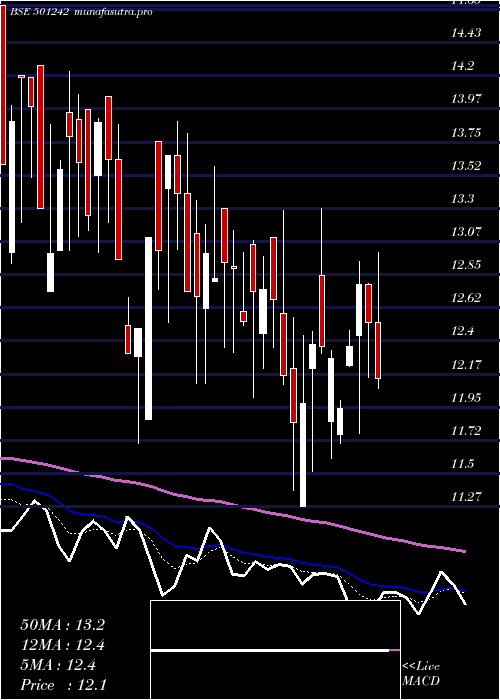
Daily price and volume Tci Finance
| Date |
Closing |
Open |
Range |
Volume |
Thu 23 October 2025 |
12.01 (-1.15%) |
11.02 |
11.02 - 12.77 |
0.3612 times |
Tue 21 October 2025 |
12.15 (3.49%) |
11.74 |
11.74 - 12.25 |
0.2585 times |
Mon 20 October 2025 |
11.74 (0.34%) |
11.01 |
11.01 - 12.15 |
0.1347 times |
Fri 17 October 2025 |
11.70 (-2.09%) |
11.85 |
11.70 - 12.39 |
1.8484 times |
Thu 16 October 2025 |
11.95 (1.27%) |
12.47 |
11.95 - 12.48 |
0.4676 times |
Wed 15 October 2025 |
11.80 (-0.08%) |
11.50 |
11.50 - 12.98 |
0.382 times |
Tue 14 October 2025 |
11.81 (-0.76%) |
11.81 |
11.66 - 11.90 |
0.0421 times |
Mon 13 October 2025 |
11.90 (-2.86%) |
12.97 |
11.90 - 12.97 |
0.1567 times |
Fri 10 October 2025 |
12.25 (-5.77%) |
13.26 |
12.04 - 13.26 |
3.127 times |
Thu 09 October 2025 |
13.00 (-4.27%) |
14.93 |
12.80 - 14.93 |
3.2218 times |
Wed 08 October 2025 |
13.58 (9.96%) |
13.58 |
13.56 - 13.58 |
0.2781 times |
Weekly price and charts TciFinance Strong weekly Stock price targets for TciFinance 501242 are 11.51 and 13.27 | Weekly Target 1 | 10.17 | | Weekly Target 2 | 11.09 | | Weekly Target 3 | 11.93 | | Weekly Target 4 | 12.85 | | Weekly Target 5 | 13.69 |
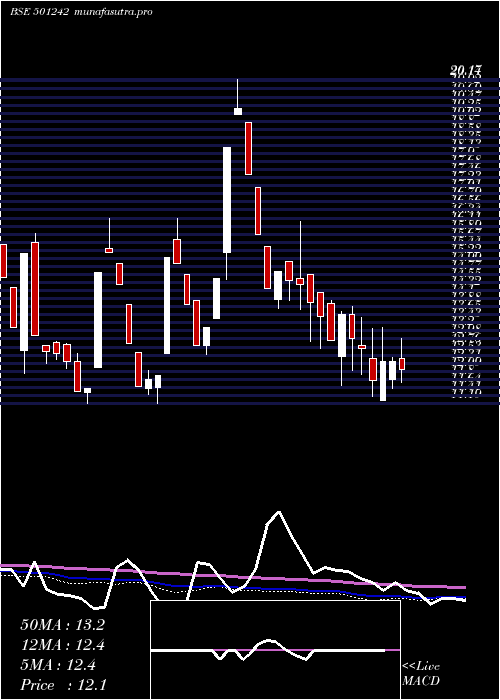
Weekly price and volumes for Tci Finance
| Date |
Closing |
Open |
Range |
Volume |
Thu 23 October 2025 |
12.01 (2.65%) |
11.01 |
11.01 - 12.77 |
0.2447 times |
Fri 17 October 2025 |
11.70 (-4.49%) |
12.97 |
11.50 - 12.98 |
0.9393 times |
Fri 10 October 2025 |
12.25 (9.28%) |
10.71 |
10.71 - 14.93 |
2.2227 times |
Fri 03 October 2025 |
11.21 (-8.94%) |
12.12 |
11.08 - 12.57 |
0.5447 times |
Fri 26 September 2025 |
12.31 (-5.31%) |
13.31 |
12.21 - 13.60 |
1.2917 times |
Fri 19 September 2025 |
13.00 (1.01%) |
12.75 |
12.23 - 13.65 |
1.8002 times |
Fri 12 September 2025 |
12.87 (-3.74%) |
12.72 |
12.60 - 14.00 |
0.8135 times |
Fri 05 September 2025 |
13.37 (-0.52%) |
13.44 |
12.40 - 13.75 |
1.1167 times |
Fri 29 August 2025 |
13.44 (-1.1%) |
13.65 |
13.00 - 13.90 |
0.4428 times |
Fri 22 August 2025 |
13.59 (0.44%) |
13.85 |
12.66 - 13.85 |
0.5837 times |
Thu 14 August 2025 |
13.53 (-4.79%) |
14.32 |
12.51 - 14.32 |
0.9215 times |
Monthly price and charts TciFinance Strong monthly Stock price targets for TciFinance 501242 are 11.36 and 15.58 | Monthly Target 1 | 8.33 | | Monthly Target 2 | 10.17 | | Monthly Target 3 | 12.55 | | Monthly Target 4 | 14.39 | | Monthly Target 5 | 16.77 |
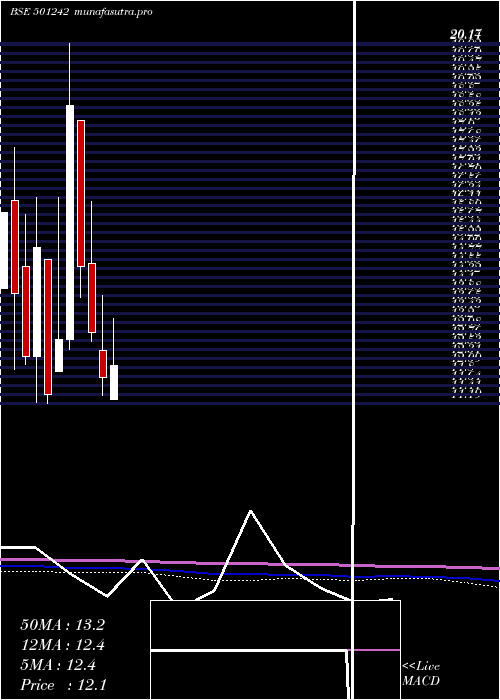
Monthly price and volumes Tci Finance
| Date |
Closing |
Open |
Range |
Volume |
Thu 23 October 2025 |
12.01 (3.62%) |
11.59 |
10.71 - 14.93 |
0.4409 times |
Tue 30 September 2025 |
11.59 (-13.76%) |
13.44 |
11.59 - 14.00 |
0.6279 times |
Fri 29 August 2025 |
13.44 (-2.96%) |
14.28 |
12.51 - 14.75 |
0.3461 times |
Thu 31 July 2025 |
13.85 (-10.59%) |
15.49 |
13.00 - 16.90 |
1.3069 times |
Mon 30 June 2025 |
15.49 (26.66%) |
12.23 |
11.79 - 18.88 |
3.1955 times |
Fri 30 May 2025 |
12.23 (6.63%) |
11.76 |
10.30 - 13.30 |
0.575 times |
Wed 30 April 2025 |
11.47 (-3.12%) |
11.27 |
11.17 - 13.30 |
0.3624 times |
Fri 28 March 2025 |
11.84 (-8.57%) |
12.50 |
11.38 - 13.89 |
0.9732 times |
Fri 28 February 2025 |
12.95 (-11.3%) |
14.67 |
12.73 - 16.23 |
1.0378 times |
Fri 31 January 2025 |
14.60 (-21.59%) |
18.25 |
13.82 - 18.25 |
1.1343 times |
Tue 31 December 2024 |
18.62 (45.58%) |
12.79 |
12.54 - 20.17 |
2.3472 times |
DMA SMA EMA moving averages of Tci Finance 501242
DMA (daily moving average) of Tci Finance 501242
| DMA period | DMA value | | 5 day DMA | 11.91 | | 12 day DMA | 12.19 | | 20 day DMA | 12.09 | | 35 day DMA | 12.48 | | 50 day DMA | 12.74 | | 100 day DMA | 13.72 | | 150 day DMA | 13.24 | | 200 day DMA | 13.71 | EMA (exponential moving average) of Tci Finance 501242
| EMA period | EMA current | EMA prev | EMA prev2 | | 5 day EMA | 11.97 | 11.95 | 11.85 | | 12 day EMA | 12.05 | 12.06 | 12.04 | | 20 day EMA | 12.18 | 12.2 | 12.2 | | 35 day EMA | 12.45 | 12.48 | 12.5 | | 50 day EMA | 12.76 | 12.79 | 12.82 |
SMA (simple moving average) of Tci Finance 501242
| SMA period | SMA current | SMA prev | SMA prev2 | | 5 day SMA | 11.91 | 11.87 | 11.8 | | 12 day SMA | 12.19 | 12.17 | 12.09 | | 20 day SMA | 12.09 | 12.13 | 12.17 | | 35 day SMA | 12.48 | 12.52 | 12.54 | | 50 day SMA | 12.74 | 12.79 | 12.82 | | 100 day SMA | 13.72 | 13.72 | 13.72 | | 150 day SMA | 13.24 | 13.24 | 13.25 | | 200 day SMA | 13.71 | 13.74 | 13.77 |
|
|
