DalalSt 501148 full analysis,charts,indicators,moving averages,SMA,DMA,EMA,ADX,MACD,RSIDalal St 501148 WideScreen charts, DMA,SMA,EMA technical analysis, forecast prediction, by indicators ADX,MACD,RSI,CCI BSE stock exchange
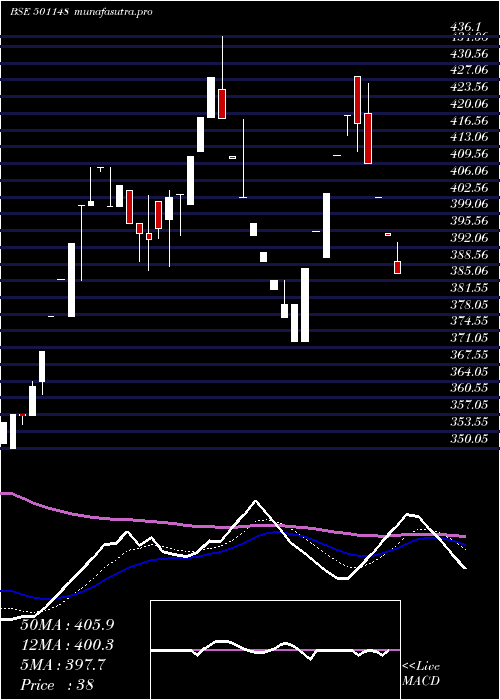
Daily price and charts and targets DalalSt Strong Daily Stock price targets for DalalSt 501148 are 410.55 and 410.55 | Daily Target 1 | 410.55 | | Daily Target 2 | 410.55 | | Daily Target 3 | 410.55 | | Daily Target 4 | 410.55 | | Daily Target 5 | 410.55 |
Daily price and volume Dalal St
| Date |
Closing |
Open |
Range |
Volume |
Tue 21 October 2025 |
410.55 (0%) |
410.55 |
410.55 - 410.55 |
0.1622 times |
Mon 20 October 2025 |
410.55 (2%) |
410.55 |
410.55 - 410.55 |
0.8108 times |
Fri 17 October 2025 |
402.50 (1.99%) |
402.50 |
402.50 - 402.50 |
0.5405 times |
Thu 16 October 2025 |
394.65 (1.99%) |
394.65 |
394.65 - 394.65 |
1.027 times |
Wed 15 October 2025 |
386.95 (1.99%) |
386.95 |
386.95 - 386.95 |
0.2703 times |
Tue 14 October 2025 |
379.40 (1.99%) |
379.40 |
379.40 - 379.40 |
1.5676 times |
Mon 13 October 2025 |
372.00 (1.99%) |
372.00 |
372.00 - 372.00 |
0.0541 times |
Thu 09 October 2025 |
364.75 (0%) |
365.00 |
364.75 - 365.00 |
4.1622 times |
Tue 07 October 2025 |
364.75 (0%) |
364.75 |
364.75 - 364.75 |
0.1081 times |
Mon 06 October 2025 |
364.75 (-1.91%) |
372.00 |
364.75 - 372.00 |
1.2973 times |
Fri 03 October 2025 |
371.85 (-1.99%) |
371.85 |
371.85 - 371.85 |
0.3784 times |
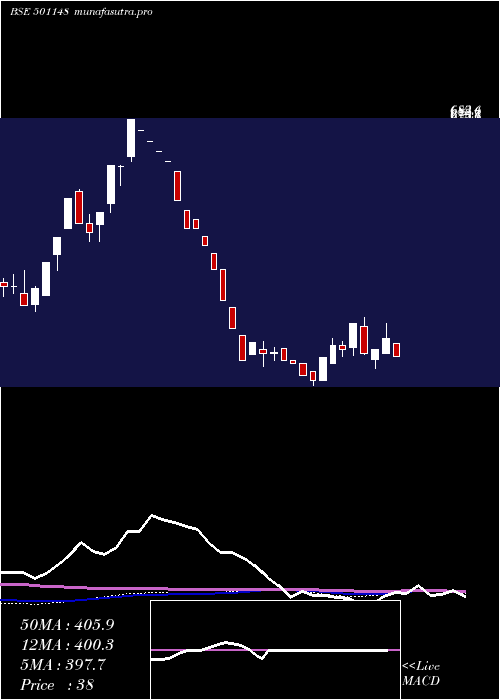
Weekly price and charts DalalSt Strong weekly Stock price targets for DalalSt 501148 are 410.55 and 410.55 | Weekly Target 1 | 410.55 | | Weekly Target 2 | 410.55 | | Weekly Target 3 | 410.55 | | Weekly Target 4 | 410.55 | | Weekly Target 5 | 410.55 |
Weekly price and volumes for Dalal St
| Date |
Closing |
Open |
Range |
Volume |
Tue 21 October 2025 |
410.55 (2%) |
410.55 |
410.55 - 410.55 |
0.1929 times |
Fri 17 October 2025 |
402.50 (10.35%) |
372.00 |
372.00 - 402.50 |
0.686 times |
Thu 09 October 2025 |
364.75 (-1.91%) |
372.00 |
364.75 - 372.00 |
1.104 times |
Fri 03 October 2025 |
371.85 (-3.94%) |
387.10 |
371.85 - 387.10 |
0.5466 times |
Fri 26 September 2025 |
387.10 (-4.36%) |
404.75 |
387.10 - 404.75 |
0.268 times |
Fri 19 September 2025 |
404.75 (-5.87%) |
430.00 |
396.70 - 430.00 |
1.2219 times |
Fri 12 September 2025 |
430.00 (0.01%) |
438.50 |
429.75 - 438.50 |
0.3751 times |
Thu 04 September 2025 |
429.95 (7.68%) |
407.25 |
407.05 - 432.10 |
2.508 times |
Fri 29 August 2025 |
399.30 (8.21%) |
376.35 |
376.35 - 399.30 |
1.1576 times |
Thu 21 August 2025 |
369.00 (-5.54%) |
390.00 |
368.35 - 390.00 |
1.94 times |
Thu 14 August 2025 |
390.65 (-5.87%) |
406.70 |
390.65 - 406.70 |
0.6752 times |
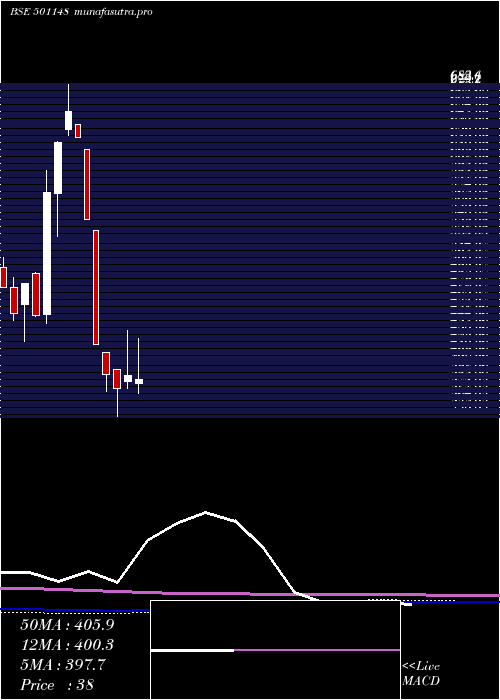
Monthly price and charts DalalSt Strong monthly Stock price targets for DalalSt 501148 are 387.65 and 433.45 | Monthly Target 1 | 349.48 | | Monthly Target 2 | 380.02 | | Monthly Target 3 | 395.28333333333 | | Monthly Target 4 | 425.82 | | Monthly Target 5 | 441.08 |
Monthly price and volumes Dalal St
| Date |
Closing |
Open |
Range |
Volume |
Tue 21 October 2025 |
410.55 (6.06%) |
379.40 |
364.75 - 410.55 |
0.3639 times |
Tue 30 September 2025 |
387.10 (-3.06%) |
407.25 |
387.10 - 438.50 |
0.6639 times |
Fri 29 August 2025 |
399.30 (-4.93%) |
420.00 |
368.35 - 420.00 |
0.6926 times |
Thu 31 July 2025 |
420.00 (-0.11%) |
428.85 |
406.70 - 446.70 |
0.9065 times |
Mon 30 June 2025 |
420.45 (7.53%) |
383.20 |
372.40 - 427.85 |
2.2167 times |
Fri 30 May 2025 |
391.00 (3.54%) |
385.20 |
377.50 - 436.10 |
2.0284 times |
Wed 30 April 2025 |
377.65 (-3.64%) |
397.00 |
350.05 - 397.00 |
0.8825 times |
Fri 28 March 2025 |
391.90 (-7.14%) |
413.65 |
374.80 - 413.65 |
1.88 times |
Fri 28 February 2025 |
422.05 (-22.91%) |
537.00 |
422.05 - 537.00 |
0.2154 times |
Mon 27 January 2025 |
547.45 (-13.17%) |
617.85 |
547.45 - 617.85 |
0.15 times |
Mon 09 December 2024 |
630.45 (-3.95%) |
643.30 |
630.45 - 643.30 |
0.0495 times |
DMA SMA EMA moving averages of Dalal St 501148
DMA (daily moving average) of Dalal St 501148
| DMA period | DMA value | | 5 day DMA | 401.04 | | 12 day DMA | 383.51 | | 20 day DMA | 387.9 | | 35 day DMA | 399.62 | | 50 day DMA | 401.46 | | 100 day DMA | 404.88 | | 150 day DMA | 405.28 | | 200 day DMA | 449.18 | EMA (exponential moving average) of Dalal St 501148
| EMA period | EMA current | EMA prev | EMA prev2 | | 5 day EMA | 401.36 | 396.76 | 389.86 | | 12 day EMA | 393.06 | 389.88 | 386.12 | | 20 day EMA | 393.37 | 391.56 | 389.56 | | 35 day EMA | 396.3 | 395.46 | 394.57 | | 50 day EMA | 403.84 | 403.57 | 403.29 |
SMA (simple moving average) of Dalal St 501148
| SMA period | SMA current | SMA prev | SMA prev2 | | 5 day SMA | 401.04 | 394.81 | 387.1 | | 12 day SMA | 383.51 | 381.55 | 379.6 | | 20 day SMA | 387.9 | 388.02 | 388.57 | | 35 day SMA | 399.62 | 398.43 | 397.44 | | 50 day SMA | 401.46 | 401.85 | 402.22 | | 100 day SMA | 404.88 | 404.86 | 404.77 | | 150 day SMA | 405.28 | 406.12 | 407.03 | | 200 day SMA | 449.18 | 449.6 | 450.01 |
|
|
