FinolexInd 500940 full analysis,charts,indicators,moving averages,SMA,DMA,EMA,ADX,MACD,RSIFinolex Ind 500940 WideScreen charts, DMA,SMA,EMA technical analysis, forecast prediction, by indicators ADX,MACD,RSI,CCI BSE stock exchange
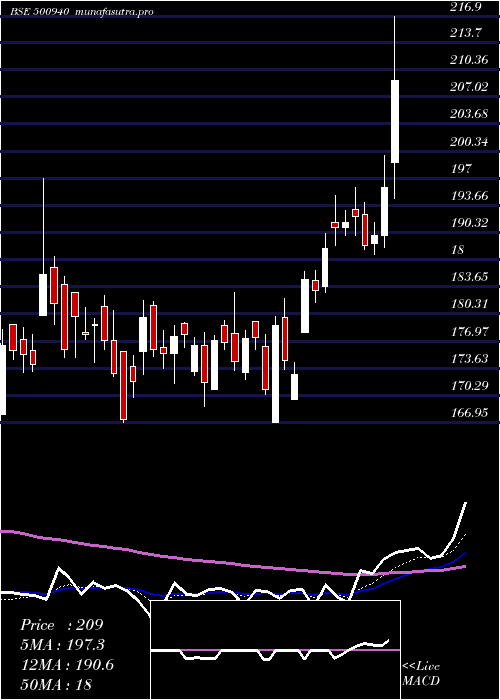
Daily price and charts and targets FinolexInd Strong Daily Stock price targets for FinolexInd 500940 are 190.35 and 192.35 | Daily Target 1 | 189.9 | | Daily Target 2 | 190.8 | | Daily Target 3 | 191.9 | | Daily Target 4 | 192.8 | | Daily Target 5 | 193.9 |
Daily price and volume Finolex Ind
| Date |
Closing |
Open |
Range |
Volume |
Tue 21 October 2025 |
191.70 (0.39%) |
192.50 |
191.00 - 193.00 |
0.2411 times |
Mon 20 October 2025 |
190.95 (0.03%) |
191.55 |
190.00 - 191.60 |
0.7493 times |
Fri 17 October 2025 |
190.90 (-0.13%) |
190.75 |
190.00 - 193.50 |
1.2922 times |
Thu 16 October 2025 |
191.15 (-0.42%) |
193.85 |
190.65 - 194.60 |
1.0983 times |
Wed 15 October 2025 |
191.95 (0.68%) |
191.90 |
189.70 - 192.75 |
0.7864 times |
Tue 14 October 2025 |
190.65 (-0.08%) |
190.80 |
189.50 - 194.00 |
1.5849 times |
Mon 13 October 2025 |
190.80 (-1.09%) |
191.70 |
190.15 - 192.55 |
0.9003 times |
Fri 10 October 2025 |
192.90 (-0.62%) |
193.60 |
192.30 - 194.95 |
1.1152 times |
Thu 09 October 2025 |
194.10 (-0.31%) |
197.00 |
192.00 - 197.00 |
0.9972 times |
Wed 08 October 2025 |
194.70 (-0.54%) |
195.30 |
194.20 - 198.15 |
1.235 times |
Tue 07 October 2025 |
195.75 (-1.86%) |
201.50 |
195.00 - 201.50 |
1.6315 times |
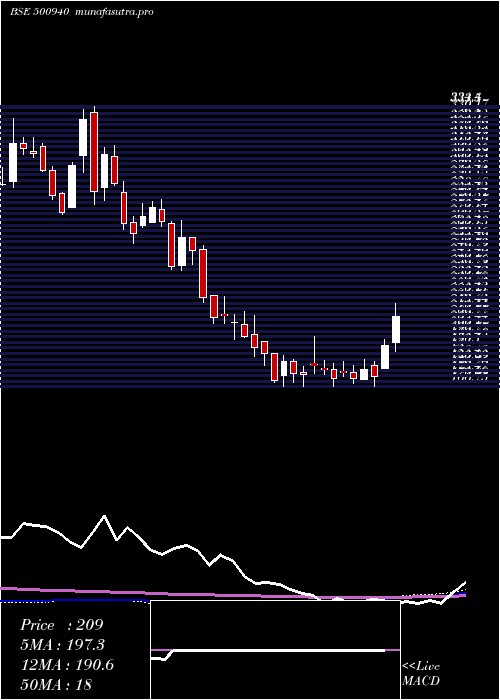
Weekly price and charts FinolexInd Strong weekly Stock price targets for FinolexInd 500940 are 190.85 and 193.85 | Weekly Target 1 | 188.57 | | Weekly Target 2 | 190.13 | | Weekly Target 3 | 191.56666666667 | | Weekly Target 4 | 193.13 | | Weekly Target 5 | 194.57 |
Weekly price and volumes for Finolex Ind
| Date |
Closing |
Open |
Range |
Volume |
Tue 21 October 2025 |
191.70 (0.42%) |
191.55 |
190.00 - 193.00 |
0.1761 times |
Fri 17 October 2025 |
190.90 (-1.04%) |
191.70 |
189.50 - 194.60 |
1.0066 times |
Fri 10 October 2025 |
192.90 (-6.29%) |
206.15 |
192.00 - 206.15 |
1.0264 times |
Fri 03 October 2025 |
205.85 (-1.1%) |
211.90 |
198.00 - 211.90 |
1.2611 times |
Fri 26 September 2025 |
208.15 (-3.97%) |
222.20 |
204.60 - 222.20 |
0.9742 times |
Fri 19 September 2025 |
216.75 (0.56%) |
215.75 |
214.20 - 223.00 |
1.7239 times |
Fri 12 September 2025 |
215.55 (0.65%) |
211.05 |
208.10 - 216.65 |
0.8166 times |
Fri 05 September 2025 |
214.15 (1.11%) |
214.15 |
209.85 - 221.15 |
0.8955 times |
Fri 29 August 2025 |
211.80 (-0.05%) |
214.80 |
205.15 - 214.85 |
0.6692 times |
Fri 22 August 2025 |
211.90 (13.01%) |
188.40 |
188.40 - 215.05 |
1.4504 times |
Thu 14 August 2025 |
187.50 (-0.74%) |
190.00 |
185.90 - 192.90 |
0.378 times |
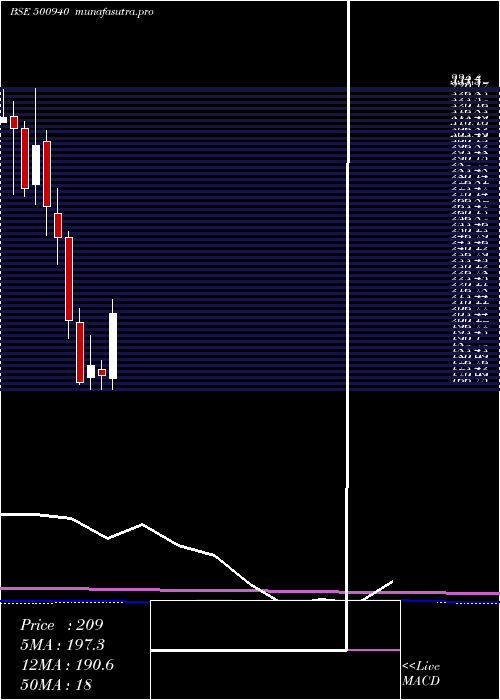
Monthly price and charts FinolexInd Strong monthly Stock price targets for FinolexInd 500940 are 182.2 and 199 | Monthly Target 1 | 179.03 | | Monthly Target 2 | 185.37 | | Monthly Target 3 | 195.83333333333 | | Monthly Target 4 | 202.17 | | Monthly Target 5 | 212.63 |
Monthly price and volumes Finolex Ind
| Date |
Closing |
Open |
Range |
Volume |
Tue 21 October 2025 |
191.70 (-4.25%) |
205.00 |
189.50 - 206.30 |
0.3316 times |
Tue 30 September 2025 |
200.20 (-5.48%) |
214.15 |
198.95 - 223.00 |
0.6753 times |
Fri 29 August 2025 |
211.80 (1.34%) |
204.05 |
185.90 - 215.05 |
0.5267 times |
Thu 31 July 2025 |
209.00 (-4.13%) |
219.85 |
201.40 - 219.85 |
0.7091 times |
Mon 30 June 2025 |
218.00 (-0.16%) |
216.30 |
210.00 - 238.00 |
1.1272 times |
Fri 30 May 2025 |
218.35 (25.13%) |
173.15 |
166.95 - 232.00 |
2.2697 times |
Wed 30 April 2025 |
174.50 (-3.03%) |
178.00 |
167.00 - 183.00 |
0.9226 times |
Fri 28 March 2025 |
179.95 (5.45%) |
173.75 |
166.75 - 196.95 |
1.3186 times |
Fri 28 February 2025 |
170.65 (-16.9%) |
204.00 |
169.55 - 212.00 |
0.8043 times |
Fri 31 January 2025 |
205.35 (-18.35%) |
251.65 |
195.35 - 255.00 |
1.3149 times |
Tue 31 December 2024 |
251.50 (-6.45%) |
265.05 |
236.30 - 278.45 |
1.3767 times |
DMA SMA EMA moving averages of Finolex Ind 500940
DMA (daily moving average) of Finolex Ind 500940
| DMA period | DMA value | | 5 day DMA | 191.33 | | 12 day DMA | 192.92 | | 20 day DMA | 198.2 | | 35 day DMA | 205.57 | | 50 day DMA | 204.51 | | 100 day DMA | 208.41 | | 150 day DMA | 199.62 | | 200 day DMA | 201.71 | EMA (exponential moving average) of Finolex Ind 500940
| EMA period | EMA current | EMA prev | EMA prev2 | | 5 day EMA | 191.53 | 191.45 | 191.7 | | 12 day EMA | 194.07 | 194.5 | 195.14 | | 20 day EMA | 197.17 | 197.75 | 198.46 | | 35 day EMA | 199.54 | 200 | 200.53 | | 50 day EMA | 202.52 | 202.96 | 203.45 |
SMA (simple moving average) of Finolex Ind 500940
| SMA period | SMA current | SMA prev | SMA prev2 | | 5 day SMA | 191.33 | 191.12 | 191.09 | | 12 day SMA | 192.92 | 194.1 | 194.8 | | 20 day SMA | 198.2 | 199.42 | 200.71 | | 35 day SMA | 205.57 | 206.21 | 206.8 | | 50 day SMA | 204.51 | 204.46 | 204.55 | | 100 day SMA | 208.41 | 208.71 | 209.05 | | 150 day SMA | 199.62 | 199.54 | 199.44 | | 200 day SMA | 201.71 | 201.95 | 202.18 |
|
|
