Ceat 500878 full analysis,charts,indicators,moving averages,SMA,DMA,EMA,ADX,MACD,RSICeat 500878 WideScreen charts, DMA,SMA,EMA technical analysis, forecast prediction, by indicators ADX,MACD,RSI,CCI BSE stock exchange
Daily price and charts and targets Ceat Strong Daily Stock price targets for Ceat 500878 are 4200.28 and 4433.78 | Daily Target 1 | 4015.32 | | Daily Target 2 | 4151.73 | | Daily Target 3 | 4248.8166666667 | | Daily Target 4 | 4385.23 | | Daily Target 5 | 4482.32 |
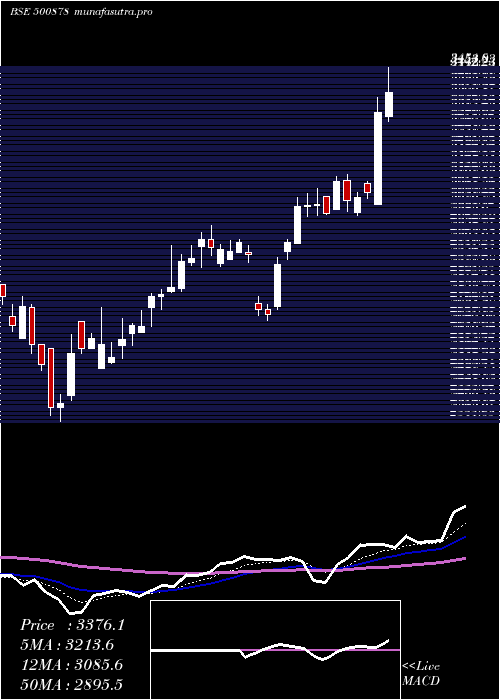
Daily price and volume Ceat
| Date |
Closing |
Open |
Range |
Volume |
Tue 21 October 2025 |
4288.15 (2.06%) |
4194.95 |
4112.40 - 4345.90 |
3.1114 times |
Mon 20 October 2025 |
4201.55 (12.55%) |
3730.00 |
3730.00 - 4251.70 |
5.7939 times |
Fri 17 October 2025 |
3733.10 (0.95%) |
3695.25 |
3663.30 - 3772.75 |
0.3997 times |
Thu 16 October 2025 |
3698.05 (4.22%) |
3588.65 |
3561.60 - 3721.00 |
0.2412 times |
Wed 15 October 2025 |
3548.30 (2.14%) |
3473.80 |
3443.10 - 3567.45 |
0.1138 times |
Tue 14 October 2025 |
3473.80 (-2.82%) |
3574.95 |
3455.00 - 3602.45 |
0.0514 times |
Mon 13 October 2025 |
3574.70 (1.09%) |
3540.00 |
3505.30 - 3589.00 |
0.0758 times |
Fri 10 October 2025 |
3536.20 (1.01%) |
3486.95 |
3486.95 - 3567.00 |
0.056 times |
Thu 09 October 2025 |
3500.80 (-0.26%) |
3509.85 |
3471.45 - 3517.45 |
0.0659 times |
Wed 08 October 2025 |
3509.85 (1.28%) |
3416.10 |
3416.10 - 3559.95 |
0.0908 times |
Tue 07 October 2025 |
3465.60 (-0.12%) |
3465.55 |
3451.20 - 3491.00 |
0.0356 times |
Weekly price and charts Ceat Strong weekly Stock price targets for Ceat 500878 are 4009.08 and 4624.98 | Weekly Target 1 | 3505.45 | | Weekly Target 2 | 3896.8 | | Weekly Target 3 | 4121.35 | | Weekly Target 4 | 4512.7 | | Weekly Target 5 | 4737.25 |
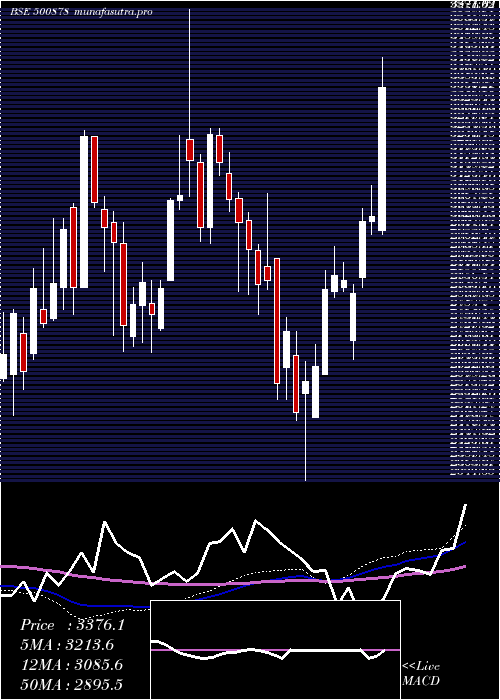
Weekly price and volumes for Ceat
| Date |
Closing |
Open |
Range |
Volume |
Tue 21 October 2025 |
4288.15 (14.87%) |
3730.00 |
3730.00 - 4345.90 |
5.9411 times |
Fri 17 October 2025 |
3733.10 (5.57%) |
3540.00 |
3443.10 - 3772.75 |
0.5884 times |
Fri 10 October 2025 |
3536.20 (0.71%) |
3514.00 |
3416.10 - 3567.00 |
0.2133 times |
Fri 03 October 2025 |
3511.25 (3.32%) |
3399.55 |
3341.00 - 3524.20 |
0.2537 times |
Fri 26 September 2025 |
3398.55 (0.21%) |
3418.45 |
3376.20 - 3580.00 |
0.4785 times |
Fri 19 September 2025 |
3391.40 (3.35%) |
3313.45 |
3283.10 - 3499.00 |
0.3799 times |
Fri 12 September 2025 |
3281.45 (-2.08%) |
3360.70 |
3271.55 - 3424.00 |
0.2456 times |
Fri 05 September 2025 |
3351.25 (7.08%) |
3199.95 |
3129.00 - 3450.00 |
0.8587 times |
Fri 29 August 2025 |
3129.70 (-1.89%) |
3197.05 |
3006.50 - 3265.00 |
0.5377 times |
Fri 22 August 2025 |
3190.10 (3.11%) |
3143.00 |
3110.05 - 3324.90 |
0.5031 times |
Thu 14 August 2025 |
3093.75 (-2.12%) |
3175.90 |
3083.90 - 3175.90 |
0.1517 times |
Monthly price and charts Ceat Strong monthly Stock price targets for Ceat 500878 are 3824.7 and 4809.35 | Monthly Target 1 | 3013.78 | | Monthly Target 2 | 3650.97 | | Monthly Target 3 | 3998.4333333333 | | Monthly Target 4 | 4635.62 | | Monthly Target 5 | 4983.08 |
Monthly price and volumes Ceat
| Date |
Closing |
Open |
Range |
Volume |
Tue 21 October 2025 |
4288.15 (26.67%) |
3458.00 |
3361.25 - 4345.90 |
2.5074 times |
Tue 30 September 2025 |
3385.20 (8.16%) |
3199.95 |
3129.00 - 3580.00 |
0.7473 times |
Fri 29 August 2025 |
3129.70 (-5.52%) |
3290.05 |
3006.50 - 3389.95 |
0.5527 times |
Thu 31 July 2025 |
3312.70 (-10.08%) |
3699.15 |
3275.00 - 4048.95 |
1.8073 times |
Mon 30 June 2025 |
3684.00 (-2.47%) |
3837.75 |
3461.60 - 3897.95 |
0.3816 times |
Fri 30 May 2025 |
3777.45 (13.95%) |
3300.05 |
3284.35 - 4042.95 |
1.555 times |
Wed 30 April 2025 |
3315.00 (15.07%) |
2850.05 |
2660.00 - 3359.80 |
0.7743 times |
Fri 28 March 2025 |
2880.90 (14.28%) |
2571.35 |
2341.65 - 2956.40 |
0.6087 times |
Fri 28 February 2025 |
2520.95 (-11.8%) |
2904.00 |
2500.00 - 3096.00 |
0.4024 times |
Fri 31 January 2025 |
2858.35 (-11.59%) |
3215.10 |
2779.00 - 3249.15 |
0.6632 times |
Tue 31 December 2024 |
3232.90 (5.04%) |
3080.00 |
2964.75 - 3581.45 |
1.9143 times |

DMA SMA EMA moving averages of Ceat 500878
DMA (daily moving average) of Ceat 500878
| DMA period | DMA value | | 5 day DMA | 3893.83 | | 12 day DMA | 3666.65 | | 20 day DMA | 3575.72 | | 35 day DMA | 3489.97 | | 50 day DMA | 3390.31 | | 100 day DMA | 3501.19 | | 150 day DMA | 3395.02 | | 200 day DMA | 3271.5 | EMA (exponential moving average) of Ceat 500878
| EMA period | EMA current | EMA prev | EMA prev2 | | 5 day EMA | 3977.04 | 3821.51 | 3631.52 | | 12 day EMA | 3753.46 | 3656.28 | 3557.18 | | 20 day EMA | 3641.85 | 3573.85 | 3507.8 | | 35 day EMA | 3517.64 | 3472.28 | 3429.35 | | 50 day EMA | 3429.08 | 3394.03 | 3361.08 |
SMA (simple moving average) of Ceat 500878
| SMA period | SMA current | SMA prev | SMA prev2 | | 5 day SMA | 3893.83 | 3730.96 | 3605.59 | | 12 day SMA | 3666.65 | 3601.91 | 3542.42 | | 20 day SMA | 3575.72 | 3534.86 | 3494.35 | | 35 day SMA | 3489.97 | 3459 | 3428.37 | | 50 day SMA | 3390.31 | 3368.8 | 3349.2 | | 100 day SMA | 3501.19 | 3495.69 | 3491.03 | | 150 day SMA | 3395.02 | 3383.47 | 3371.45 | | 200 day SMA | 3271.5 | 3265.26 | 3259.29 |
|
|
