AsianPaints 500820 full analysis,charts,indicators,moving averages,SMA,DMA,EMA,ADX,MACD,RSIAsian Paints 500820 WideScreen charts, DMA,SMA,EMA technical analysis, forecast prediction, by indicators ADX,MACD,RSI,CCI BSE stock exchange
Daily price and charts and targets AsianPaints Strong Daily Stock price targets for AsianPaints 500820 are 2954.58 and 2986.08 | Daily Target 1 | 2929.38 | | Daily Target 2 | 2948.27 | | Daily Target 3 | 2960.8833333333 | | Daily Target 4 | 2979.77 | | Daily Target 5 | 2992.38 |
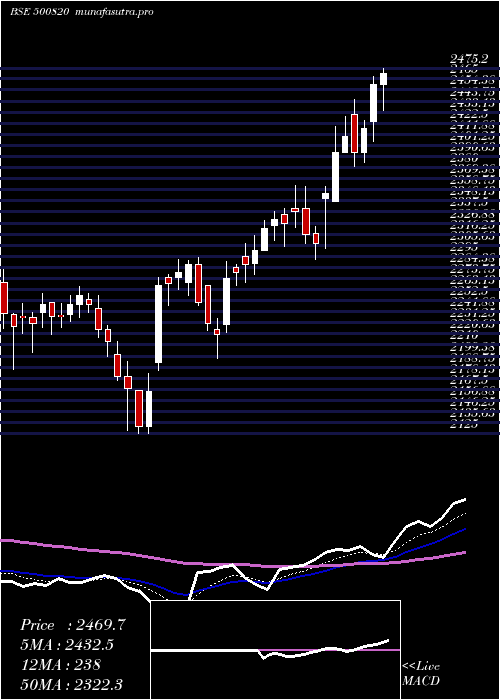
Daily price and volume Asian Paints
| Date |
Closing |
Open |
Range |
Volume |
Fri 05 December 2025 |
2967.15 (0.34%) |
2955.00 |
2942.00 - 2973.50 |
0.2811 times |
Thu 04 December 2025 |
2957.15 (0.18%) |
2951.85 |
2936.50 - 2985.50 |
4.6588 times |
Wed 03 December 2025 |
2951.85 (-0.07%) |
2958.15 |
2932.30 - 2968.90 |
0.795 times |
Tue 02 December 2025 |
2953.85 (3.11%) |
2863.00 |
2863.00 - 2962.40 |
0.9563 times |
Mon 01 December 2025 |
2864.70 (-0.3%) |
2872.25 |
2847.75 - 2884.40 |
0.2831 times |
Fri 28 November 2025 |
2873.40 (-0.18%) |
2878.60 |
2858.00 - 2889.00 |
0.268 times |
Thu 27 November 2025 |
2878.60 (0.12%) |
2875.10 |
2872.00 - 2913.00 |
0.8013 times |
Wed 26 November 2025 |
2875.05 (-0.03%) |
2880.00 |
2858.30 - 2895.95 |
0.8028 times |
Tue 25 November 2025 |
2875.80 (-0.09%) |
2890.45 |
2871.80 - 2909.00 |
0.3461 times |
Mon 24 November 2025 |
2878.35 (0.07%) |
2879.95 |
2865.70 - 2896.20 |
0.8076 times |
Fri 21 November 2025 |
2876.30 (0.6%) |
2865.00 |
2855.30 - 2895.00 |
0.4692 times |
Weekly price and charts AsianPaints Strong weekly Stock price targets for AsianPaints 500820 are 2907.45 and 3045.2 | Weekly Target 1 | 2795.72 | | Weekly Target 2 | 2881.43 | | Weekly Target 3 | 2933.4666666667 | | Weekly Target 4 | 3019.18 | | Weekly Target 5 | 3071.22 |
Weekly price and volumes for Asian Paints
| Date |
Closing |
Open |
Range |
Volume |
Fri 05 December 2025 |
2967.15 (3.26%) |
2872.25 |
2847.75 - 2985.50 |
1.2888 times |
Fri 28 November 2025 |
2873.40 (-0.1%) |
2879.95 |
2858.00 - 2913.00 |
0.5591 times |
Fri 21 November 2025 |
2876.30 (-1.04%) |
2901.20 |
2852.20 - 2926.00 |
1.0963 times |
Fri 14 November 2025 |
2906.40 (10.99%) |
2615.00 |
2615.00 - 2909.30 |
2.4659 times |
Fri 07 November 2025 |
2618.55 (4.32%) |
2500.00 |
2480.05 - 2630.00 |
1.6065 times |
Fri 31 October 2025 |
2510.00 (0.33%) |
2491.70 |
2491.70 - 2550.00 |
1.0374 times |
Thu 23 October 2025 |
2501.85 (-0.23%) |
2509.95 |
2487.65 - 2545.00 |
0.4672 times |
Fri 17 October 2025 |
2507.65 (7.15%) |
2328.10 |
2310.00 - 2543.10 |
0.8822 times |
Fri 10 October 2025 |
2340.30 (-0.76%) |
2345.70 |
2320.45 - 2371.65 |
0.2408 times |
Fri 03 October 2025 |
2358.30 (0.67%) |
2342.00 |
2317.60 - 2389.30 |
0.3557 times |
Fri 26 September 2025 |
2342.50 (-5.72%) |
2486.90 |
2340.00 - 2503.20 |
0.8068 times |

Monthly price and charts AsianPaints Strong monthly Stock price targets for AsianPaints 500820 are 2907.45 and 3045.2 | Monthly Target 1 | 2795.72 | | Monthly Target 2 | 2881.43 | | Monthly Target 3 | 2933.4666666667 | | Monthly Target 4 | 3019.18 | | Monthly Target 5 | 3071.22 |
Monthly price and volumes Asian Paints
| Date |
Closing |
Open |
Range |
Volume |
Fri 05 December 2025 |
2967.15 (3.26%) |
2872.25 |
2847.75 - 2985.50 |
0.3405 times |
Fri 28 November 2025 |
2873.40 (14.48%) |
2500.00 |
2480.05 - 2926.00 |
1.5134 times |
Fri 31 October 2025 |
2510.00 (6.8%) |
2358.75 |
2310.00 - 2550.00 |
0.7438 times |
Tue 30 September 2025 |
2350.15 (-6.64%) |
2517.40 |
2329.55 - 2601.55 |
0.5742 times |
Fri 29 August 2025 |
2517.40 (5.07%) |
2388.00 |
2388.00 - 2594.00 |
1.6149 times |
Thu 31 July 2025 |
2396.00 (2.33%) |
2369.00 |
2319.95 - 2534.00 |
1.0557 times |
Mon 30 June 2025 |
2341.35 (3.6%) |
2261.25 |
2175.00 - 2367.20 |
1.0155 times |
Fri 30 May 2025 |
2260.05 (-6.74%) |
2420.65 |
2230.35 - 2474.50 |
0.9465 times |
Wed 30 April 2025 |
2423.30 (3.66%) |
2340.65 |
2292.35 - 2490.70 |
0.8484 times |
Fri 28 March 2025 |
2337.70 (7.24%) |
2180.00 |
2125.00 - 2362.70 |
1.3472 times |
Fri 28 February 2025 |
2179.95 (-5.26%) |
2369.80 |
2176.00 - 2416.20 |
1.2957 times |

DMA SMA EMA moving averages of Asian Paints 500820
DMA (daily moving average) of Asian Paints 500820
| DMA period | DMA value | | 5 day DMA | 2938.94 | | 12 day DMA | 2900.95 | | 20 day DMA | 2854.32 | | 35 day DMA | 2697.81 | | 50 day DMA | 2599.96 | | 100 day DMA | 2538.01 | | 150 day DMA | 2465.98 | | 200 day DMA | 2424.2 | EMA (exponential moving average) of Asian Paints 500820
| EMA period | EMA current | EMA prev | EMA prev2 | | 5 day EMA | 2942.3 | 2929.88 | 2916.25 | | 12 day EMA | 2896.61 | 2883.79 | 2870.46 | | 20 day EMA | 2837.79 | 2824.18 | 2810.19 | | 35 day EMA | 2738.16 | 2724.68 | 2710.99 | | 50 day EMA | 2624.76 | 2610.79 | 2596.66 |
SMA (simple moving average) of Asian Paints 500820
| SMA period | SMA current | SMA prev | SMA prev2 | | 5 day SMA | 2938.94 | 2920.19 | 2904.48 | | 12 day SMA | 2900.95 | 2895.81 | 2889.96 | | 20 day SMA | 2854.32 | 2836.22 | 2812.69 | | 35 day SMA | 2697.81 | 2680.04 | 2662.42 | | 50 day SMA | 2599.96 | 2590.31 | 2580.74 | | 100 day SMA | 2538.01 | 2533.32 | 2528.6 | | 150 day SMA | 2465.98 | 2462.55 | 2459.04 | | 200 day SMA | 2424.2 | 2420.83 | 2417.55 |
|
|
