GujSt 500690 full analysis,charts,indicators,moving averages,SMA,DMA,EMA,ADX,MACD,RSIGuj St 500690 WideScreen charts, DMA,SMA,EMA technical analysis, forecast prediction, by indicators ADX,MACD,RSI,CCI BSE stock exchange
Daily price and charts and targets GujSt Strong Daily Stock price targets for GujSt 500690 are 191.55 and 192.95 | Daily Target 1 | 190.72 | | Daily Target 2 | 191.48 | | Daily Target 3 | 192.11666666667 | | Daily Target 4 | 192.88 | | Daily Target 5 | 193.52 |
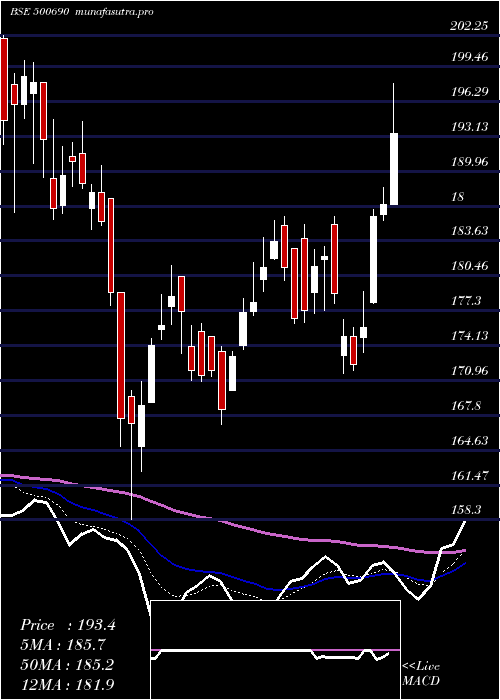
Daily price and volume Guj St
| Date |
Closing |
Open |
Range |
Volume |
Tue 21 October 2025 |
192.25 (0.52%) |
192.25 |
191.35 - 192.75 |
0.2016 times |
Mon 20 October 2025 |
191.25 (0.71%) |
189.65 |
189.65 - 191.50 |
0.7457 times |
Fri 17 October 2025 |
189.90 (-1.33%) |
192.35 |
189.15 - 192.50 |
0.8621 times |
Thu 16 October 2025 |
192.45 (0.84%) |
190.30 |
190.30 - 195.10 |
1.3256 times |
Wed 15 October 2025 |
190.85 (1.11%) |
191.45 |
188.75 - 191.45 |
0.5692 times |
Tue 14 October 2025 |
188.75 (-1.26%) |
191.25 |
188.05 - 192.45 |
1.5104 times |
Mon 13 October 2025 |
191.15 (-1.47%) |
193.70 |
189.95 - 194.00 |
2.3378 times |
Fri 10 October 2025 |
194.00 (0.23%) |
193.60 |
193.20 - 195.00 |
0.577 times |
Thu 09 October 2025 |
193.55 (-0.59%) |
195.20 |
193.05 - 195.95 |
0.636 times |
Wed 08 October 2025 |
194.70 (-0.71%) |
196.30 |
194.25 - 197.75 |
1.2346 times |
Tue 07 October 2025 |
196.10 (-0.23%) |
198.05 |
194.70 - 199.20 |
1.1311 times |
Weekly price and charts GujSt Strong weekly Stock price targets for GujSt 500690 are 190.95 and 194.05 | Weekly Target 1 | 188.45 | | Weekly Target 2 | 190.35 | | Weekly Target 3 | 191.55 | | Weekly Target 4 | 193.45 | | Weekly Target 5 | 194.65 |
Weekly price and volumes for Guj St
| Date |
Closing |
Open |
Range |
Volume |
Tue 21 October 2025 |
192.25 (1.24%) |
189.65 |
189.65 - 192.75 |
0.1287 times |
Fri 17 October 2025 |
189.90 (-2.11%) |
193.70 |
188.05 - 195.10 |
0.8974 times |
Fri 10 October 2025 |
194.00 (-2.73%) |
199.45 |
193.05 - 199.90 |
0.7075 times |
Fri 03 October 2025 |
199.45 (1.04%) |
199.50 |
195.25 - 199.80 |
0.7419 times |
Fri 26 September 2025 |
197.40 (-6.45%) |
210.05 |
196.25 - 210.70 |
0.7131 times |
Fri 19 September 2025 |
211.00 (3.81%) |
203.50 |
203.25 - 212.75 |
0.9752 times |
Fri 12 September 2025 |
203.25 (-4.93%) |
206.05 |
202.90 - 213.40 |
0.7343 times |
Fri 05 September 2025 |
213.80 (8.23%) |
199.40 |
198.00 - 220.75 |
2.1251 times |
Fri 29 August 2025 |
197.55 (-6.02%) |
211.55 |
196.00 - 213.30 |
0.9668 times |
Fri 22 August 2025 |
210.20 (3.65%) |
205.00 |
202.55 - 216.50 |
2.01 times |
Thu 14 August 2025 |
202.80 (-4.92%) |
212.25 |
201.90 - 213.90 |
1.2159 times |

Monthly price and charts GujSt Strong monthly Stock price targets for GujSt 500690 are 184.23 and 196.08 | Monthly Target 1 | 181.55 | | Monthly Target 2 | 186.9 | | Monthly Target 3 | 193.4 | | Monthly Target 4 | 198.75 | | Monthly Target 5 | 205.25 |
Monthly price and volumes Guj St
| Date |
Closing |
Open |
Range |
Volume |
Tue 21 October 2025 |
192.25 (-2.11%) |
198.20 |
188.05 - 199.90 |
0.4251 times |
Tue 30 September 2025 |
196.40 (-0.58%) |
199.40 |
195.60 - 220.75 |
0.9607 times |
Fri 29 August 2025 |
197.55 (-3%) |
204.00 |
194.30 - 216.50 |
1.6334 times |
Thu 31 July 2025 |
203.65 (-0.24%) |
204.55 |
196.05 - 212.00 |
0.702 times |
Mon 30 June 2025 |
204.15 (2.23%) |
198.95 |
192.50 - 217.20 |
1.2497 times |
Fri 30 May 2025 |
199.70 (7.25%) |
186.50 |
179.85 - 209.05 |
1.0006 times |
Wed 30 April 2025 |
186.20 (5.02%) |
178.95 |
171.55 - 198.25 |
0.7346 times |
Fri 28 March 2025 |
177.30 (5.82%) |
169.55 |
158.30 - 185.80 |
1.0308 times |
Fri 28 February 2025 |
167.55 (-18.31%) |
208.35 |
165.00 - 211.40 |
0.7157 times |
Fri 31 January 2025 |
205.10 (3.85%) |
198.55 |
183.70 - 215.00 |
1.5474 times |
Tue 31 December 2024 |
197.50 (-11.85%) |
223.60 |
191.90 - 231.35 |
1.2931 times |

DMA SMA EMA moving averages of Guj St 500690
DMA (daily moving average) of Guj St 500690
| DMA period | DMA value | | 5 day DMA | 191.34 | | 12 day DMA | 192.63 | | 20 day DMA | 195.17 | | 35 day DMA | 201.25 | | 50 day DMA | 202.65 | | 100 day DMA | 203.31 | | 150 day DMA | 198 | | 200 day DMA | 197.67 | EMA (exponential moving average) of Guj St 500690
| EMA period | EMA current | EMA prev | EMA prev2 | | 5 day EMA | 191.58 | 191.25 | 191.25 | | 12 day EMA | 193.08 | 193.23 | 193.59 | | 20 day EMA | 195.32 | 195.64 | 196.1 | | 35 day EMA | 198.14 | 198.49 | 198.92 | | 50 day EMA | 201.49 | 201.87 | 202.3 |
SMA (simple moving average) of Guj St 500690
| SMA period | SMA current | SMA prev | SMA prev2 | | 5 day SMA | 191.34 | 190.64 | 190.62 | | 12 day SMA | 192.63 | 193.23 | 193.68 | | 20 day SMA | 195.17 | 195.83 | 196.82 | | 35 day SMA | 201.25 | 201.61 | 201.79 | | 50 day SMA | 202.65 | 202.78 | 203.02 | | 100 day SMA | 203.31 | 203.42 | 203.56 | | 150 day SMA | 198 | 197.88 | 197.73 | | 200 day SMA | 197.67 | 197.72 | 197.79 |
|
|
