Glaxosmith 500660 full analysis,charts,indicators,moving averages,SMA,DMA,EMA,ADX,MACD,RSIGlaxosmith 500660 WideScreen charts, DMA,SMA,EMA technical analysis, forecast prediction, by indicators ADX,MACD,RSI,CCI BSE stock exchange
Daily price and charts and targets Glaxosmith Strong Daily Stock price targets for Glaxosmith 500660 are 2756.28 and 2768.78 | Daily Target 1 | 2746.03 | | Daily Target 2 | 2754.02 | | Daily Target 3 | 2758.5333333333 | | Daily Target 4 | 2766.52 | | Daily Target 5 | 2771.03 |
Daily price and volume Glaxosmith
| Date |
Closing |
Open |
Range |
Volume |
Tue 21 October 2025 |
2762.00 (0.6%) |
2758.75 |
2750.55 - 2763.05 |
0.1058 times |
Mon 20 October 2025 |
2745.55 (0.15%) |
2719.50 |
2719.50 - 2753.40 |
0.7975 times |
Fri 17 October 2025 |
2741.35 (0.47%) |
2717.05 |
2710.85 - 2750.00 |
1.4354 times |
Thu 16 October 2025 |
2728.45 (-0.29%) |
2738.35 |
2717.00 - 2744.95 |
1.2297 times |
Wed 15 October 2025 |
2736.50 (-0.96%) |
2756.05 |
2730.00 - 2756.05 |
0.5553 times |
Tue 14 October 2025 |
2763.15 (0.44%) |
2750.10 |
2746.00 - 2773.30 |
1.0231 times |
Mon 13 October 2025 |
2751.05 (-0.47%) |
2726.05 |
2726.05 - 2777.30 |
0.5239 times |
Fri 10 October 2025 |
2764.05 (0.2%) |
2758.65 |
2736.60 - 2781.00 |
0.7966 times |
Thu 09 October 2025 |
2758.60 (1.13%) |
2735.65 |
2714.95 - 2769.50 |
2.1197 times |
Wed 08 October 2025 |
2727.80 (-0.41%) |
2739.00 |
2722.00 - 2755.00 |
1.4131 times |
Tue 07 October 2025 |
2738.95 (0.12%) |
2735.75 |
2719.00 - 2764.70 |
1.3693 times |
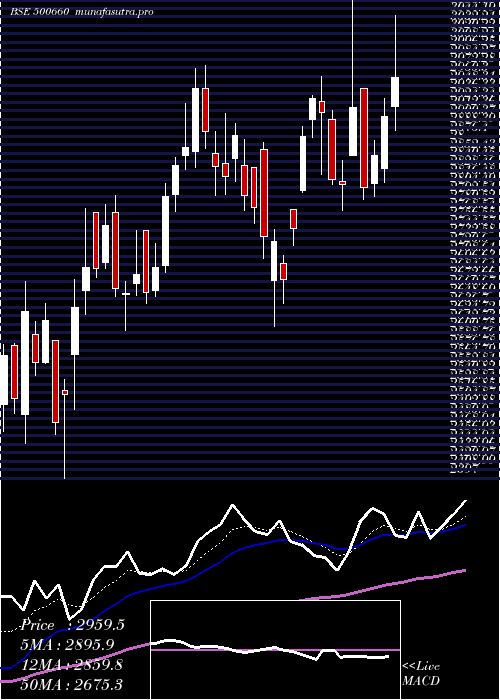
Weekly price and charts Glaxosmith Strong weekly Stock price targets for Glaxosmith 500660 are 2740.75 and 2784.3 | Weekly Target 1 | 2704.63 | | Weekly Target 2 | 2733.32 | | Weekly Target 3 | 2748.1833333333 | | Weekly Target 4 | 2776.87 | | Weekly Target 5 | 2791.73 |
Weekly price and volumes for Glaxosmith
| Date |
Closing |
Open |
Range |
Volume |
Tue 21 October 2025 |
2762.00 (0.75%) |
2719.50 |
2719.50 - 2763.05 |
0.1072 times |
Fri 17 October 2025 |
2741.35 (-0.82%) |
2726.05 |
2710.85 - 2777.30 |
0.566 times |
Fri 10 October 2025 |
2764.05 (1.06%) |
2745.00 |
2699.05 - 2781.00 |
0.879 times |
Fri 03 October 2025 |
2735.10 (2.41%) |
2631.15 |
2625.00 - 2756.05 |
0.5862 times |
Fri 26 September 2025 |
2670.70 (-2.46%) |
2749.90 |
2641.65 - 2780.00 |
0.7297 times |
Fri 19 September 2025 |
2737.95 (-1.33%) |
2775.05 |
2718.15 - 2789.75 |
1.2045 times |
Fri 12 September 2025 |
2774.95 (0.17%) |
2804.00 |
2757.85 - 2879.65 |
1.4241 times |
Fri 05 September 2025 |
2770.30 (-0.47%) |
2790.05 |
2700.50 - 2899.90 |
1.7933 times |
Fri 29 August 2025 |
2783.45 (-0.57%) |
2801.00 |
2725.00 - 2864.00 |
0.8751 times |
Fri 22 August 2025 |
2799.50 (1.12%) |
2769.95 |
2701.65 - 2855.35 |
1.8348 times |
Thu 14 August 2025 |
2768.50 (4.53%) |
2647.80 |
2565.00 - 2791.75 |
3.6233 times |

Monthly price and charts Glaxosmith Strong monthly Stock price targets for Glaxosmith 500660 are 2716.5 and 2826.5 | Monthly Target 1 | 2628 | | Monthly Target 2 | 2695 | | Monthly Target 3 | 2738 | | Monthly Target 4 | 2805 | | Monthly Target 5 | 2848 |
Monthly price and volumes Glaxosmith
| Date |
Closing |
Open |
Range |
Volume |
Tue 21 October 2025 |
2762.00 (3.97%) |
2681.65 |
2671.00 - 2781.00 |
0.1233 times |
Tue 30 September 2025 |
2656.65 (-4.56%) |
2790.05 |
2625.00 - 2899.90 |
0.3778 times |
Fri 29 August 2025 |
2783.45 (-11.86%) |
3150.00 |
2565.00 - 3180.00 |
0.6833 times |
Thu 31 July 2025 |
3158.15 (-6.75%) |
3419.95 |
3000.00 - 3450.05 |
0.3239 times |
Mon 30 June 2025 |
3386.70 (2.78%) |
3295.00 |
3152.05 - 3515.95 |
0.6763 times |
Fri 30 May 2025 |
3295.00 (11.34%) |
2956.95 |
2699.30 - 3396.00 |
1.959 times |
Wed 30 April 2025 |
2959.45 (2.86%) |
2835.05 |
2609.00 - 3147.45 |
1.027 times |
Fri 28 March 2025 |
2877.30 (16.28%) |
2519.95 |
2397.00 - 2975.00 |
0.722 times |
Fri 28 February 2025 |
2474.55 (25.21%) |
1950.00 |
1924.30 - 2744.95 |
3.5638 times |
Fri 31 January 2025 |
1976.25 (-12.24%) |
2252.00 |
1963.00 - 2271.20 |
0.5436 times |
Tue 31 December 2024 |
2252.00 (-7.92%) |
2440.00 |
2164.05 - 2459.95 |
0.4291 times |

DMA SMA EMA moving averages of Glaxosmith 500660
DMA (daily moving average) of Glaxosmith 500660
| DMA period | DMA value | | 5 day DMA | 2742.77 | | 12 day DMA | 2746.1 | | 20 day DMA | 2730.52 | | 35 day DMA | 2752.36 | | 50 day DMA | 2753.93 | | 100 day DMA | 2984.74 | | 150 day DMA | 2936.21 | | 200 day DMA | 2757.75 | EMA (exponential moving average) of Glaxosmith 500660
| EMA period | EMA current | EMA prev | EMA prev2 | | 5 day EMA | 2749.04 | 2742.56 | 2741.07 | | 12 day EMA | 2743.65 | 2740.31 | 2739.36 | | 20 day EMA | 2743.16 | 2741.18 | 2740.72 | | 35 day EMA | 2747.87 | 2747.04 | 2747.13 | | 50 day EMA | 2757.19 | 2756.99 | 2757.46 |
SMA (simple moving average) of Glaxosmith 500660
| SMA period | SMA current | SMA prev | SMA prev2 | | 5 day SMA | 2742.77 | 2743 | 2744.1 | | 12 day SMA | 2746.1 | 2743.86 | 2739.61 | | 20 day SMA | 2730.52 | 2730.47 | 2730.09 | | 35 day SMA | 2752.36 | 2753.58 | 2754.66 | | 50 day SMA | 2753.93 | 2752.27 | 2751.59 | | 100 day SMA | 2984.74 | 2990.62 | 2994.35 | | 150 day SMA | 2936.21 | 2935.75 | 2935.02 | | 200 day SMA | 2757.75 | 2755.36 | 2753.05 |
|
|
