GreatEaste 500620 full analysis,charts,indicators,moving averages,SMA,DMA,EMA,ADX,MACD,RSIGreat Easte 500620 WideScreen charts, DMA,SMA,EMA technical analysis, forecast prediction, by indicators ADX,MACD,RSI,CCI BSE stock exchange
Daily price and charts and targets GreatEaste Strong Daily Stock price targets for GreatEaste 500620 are 955.25 and 973.5 | Daily Target 1 | 942.03 | | Daily Target 2 | 950.22 | | Daily Target 3 | 960.28333333333 | | Daily Target 4 | 968.47 | | Daily Target 5 | 978.53 |
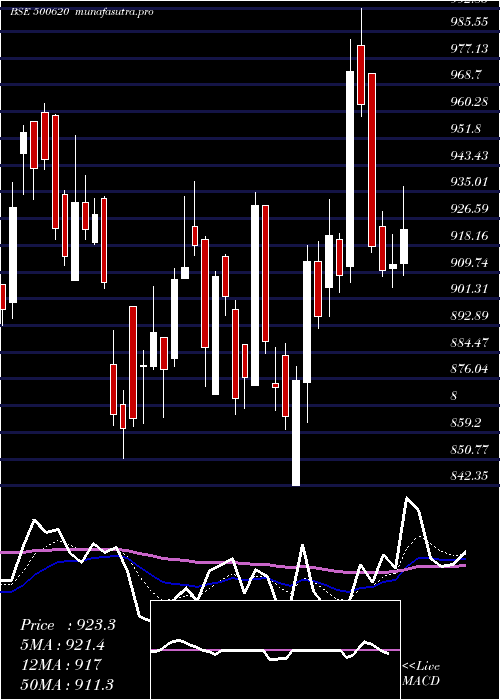
Daily price and volume Great Easte
| Date |
Closing |
Open |
Range |
Volume |
Wed 03 September 2025 |
958.40 (-0.32%) |
952.10 |
952.10 - 970.35 |
2.0899 times |
Tue 02 September 2025 |
961.45 (0.66%) |
964.65 |
949.60 - 973.60 |
0.6532 times |
Mon 01 September 2025 |
955.10 (2.92%) |
926.00 |
922.25 - 961.10 |
1.0597 times |
Fri 29 August 2025 |
928.00 (-0.49%) |
932.65 |
925.00 - 943.75 |
0.5928 times |
Thu 28 August 2025 |
932.60 (-1.56%) |
940.00 |
928.25 - 944.10 |
0.9154 times |
Tue 26 August 2025 |
947.40 (-0.64%) |
959.80 |
938.70 - 959.80 |
0.687 times |
Mon 25 August 2025 |
953.50 (-1.5%) |
962.45 |
951.60 - 970.10 |
1.4691 times |
Fri 22 August 2025 |
968.00 (-1.16%) |
975.55 |
964.30 - 981.45 |
0.5033 times |
Thu 21 August 2025 |
979.40 (-0.42%) |
976.05 |
974.45 - 989.95 |
1.2019 times |
Wed 20 August 2025 |
983.50 (0.18%) |
994.85 |
978.00 - 994.85 |
0.8279 times |
Tue 19 August 2025 |
981.75 (0.79%) |
968.15 |
968.15 - 984.35 |
1.9688 times |
Weekly price and charts GreatEaste Strong weekly Stock price targets for GreatEaste 500620 are 940.33 and 991.68 | Weekly Target 1 | 900.07 | | Weekly Target 2 | 929.23 | | Weekly Target 3 | 951.41666666667 | | Weekly Target 4 | 980.58 | | Weekly Target 5 | 1002.77 |
Weekly price and volumes for Great Easte
| Date |
Closing |
Open |
Range |
Volume |
Wed 03 September 2025 |
958.40 (3.28%) |
926.00 |
922.25 - 973.60 |
0.3202 times |
Fri 29 August 2025 |
928.00 (-4.13%) |
962.45 |
925.00 - 970.10 |
0.3085 times |
Fri 22 August 2025 |
968.00 (-0.1%) |
979.90 |
959.55 - 994.85 |
0.4929 times |
Thu 14 August 2025 |
969.00 (4.24%) |
938.45 |
922.40 - 976.50 |
0.5494 times |
Fri 08 August 2025 |
929.60 (-0.11%) |
926.20 |
914.65 - 943.75 |
0.4367 times |
Fri 01 August 2025 |
930.60 (-3.19%) |
964.95 |
915.00 - 966.00 |
0.8782 times |
Fri 25 July 2025 |
961.25 (-3.01%) |
983.05 |
947.70 - 1007.65 |
0.4552 times |
Fri 18 July 2025 |
991.05 (-0.15%) |
990.95 |
982.35 - 1008.85 |
0.9719 times |
Fri 11 July 2025 |
992.55 (-3.91%) |
1046.85 |
990.10 - 1053.70 |
1.6723 times |
Fri 04 July 2025 |
1032.95 (6.07%) |
975.00 |
972.05 - 1040.00 |
3.9146 times |
Fri 27 June 2025 |
973.80 (1.8%) |
968.05 |
962.95 - 1005.00 |
2.6755 times |
Monthly price and charts GreatEaste Strong monthly Stock price targets for GreatEaste 500620 are 940.33 and 991.68 | Monthly Target 1 | 900.07 | | Monthly Target 2 | 929.23 | | Monthly Target 3 | 951.41666666667 | | Monthly Target 4 | 980.58 | | Monthly Target 5 | 1002.77 |
Monthly price and volumes Great Easte
| Date |
Closing |
Open |
Range |
Volume |
Wed 03 September 2025 |
958.40 (3.28%) |
926.00 |
922.25 - 973.60 |
0.0496 times |
Fri 29 August 2025 |
928.00 (-0.91%) |
932.30 |
914.65 - 994.85 |
0.3105 times |
Thu 31 July 2025 |
936.55 (-4.4%) |
981.20 |
918.00 - 1053.70 |
1.1429 times |
Mon 30 June 2025 |
979.65 (5.24%) |
927.95 |
927.70 - 1049.70 |
2.8544 times |
Fri 30 May 2025 |
930.90 (7.01%) |
886.80 |
842.35 - 992.85 |
1.3154 times |
Wed 30 April 2025 |
869.90 (-6.62%) |
931.60 |
850.90 - 940.15 |
0.5201 times |
Fri 28 March 2025 |
931.60 (14.96%) |
818.75 |
797.25 - 962.95 |
0.7538 times |
Fri 28 February 2025 |
810.40 (-17.58%) |
989.95 |
807.50 - 989.95 |
0.8018 times |
Fri 31 January 2025 |
983.20 (2.07%) |
972.00 |
880.00 - 1005.40 |
1.0963 times |
Tue 31 December 2024 |
963.30 (-12.5%) |
1095.00 |
941.00 - 1124.80 |
1.1552 times |
Fri 29 November 2024 |
1100.95 (-14.62%) |
1290.00 |
1042.60 - 1335.00 |
0.7563 times |
DMA SMA EMA moving averages of Great Easte 500620
DMA (daily moving average) of Great Easte 500620
| DMA period | DMA value | | 5 day DMA | 947.11 | | 12 day DMA | 960.27 | | 20 day DMA | 954.79 | | 35 day DMA | 960.03 | | 50 day DMA | 971.5 | | 100 day DMA | 949.71 | | 150 day DMA | 936.46 | | 200 day DMA | 965.45 | EMA (exponential moving average) of Great Easte 500620
| EMA period | EMA current | EMA prev | EMA prev2 | | 5 day EMA | 954.13 | 952 | 947.28 | | 12 day EMA | 955.08 | 954.48 | 953.21 | | 20 day EMA | 956.92 | 956.76 | 956.27 | | 35 day EMA | 964.1 | 964.44 | 964.62 | | 50 day EMA | 969.92 | 970.39 | 970.75 |
SMA (simple moving average) of Great Easte 500620
| SMA period | SMA current | SMA prev | SMA prev2 | | 5 day SMA | 947.11 | 944.91 | 943.32 | | 12 day SMA | 960.27 | 961.15 | 960.93 | | 20 day SMA | 954.79 | 953.35 | 951.81 | | 35 day SMA | 960.03 | 961.03 | 961.92 | | 50 day SMA | 971.5 | 972.22 | 972.13 | | 100 day SMA | 949.71 | 949.4 | 949.02 | | 150 day SMA | 936.46 | 936.66 | 936.34 | | 200 day SMA | 965.45 | 967.12 | 968.73 |
|
|
