TataSteel 500470 full analysis,charts,indicators,moving averages,SMA,DMA,EMA,ADX,MACD,RSITata Steel 500470 WideScreen charts, DMA,SMA,EMA technical analysis, forecast prediction, by indicators ADX,MACD,RSI,CCI BSE stock exchange
Daily price and charts and targets TataSteel Strong Daily Stock price targets for TataSteel 500470 are 166.05 and 168.7 | Daily Target 1 | 163.93 | | Daily Target 2 | 165.52 | | Daily Target 3 | 166.58333333333 | | Daily Target 4 | 168.17 | | Daily Target 5 | 169.23 |
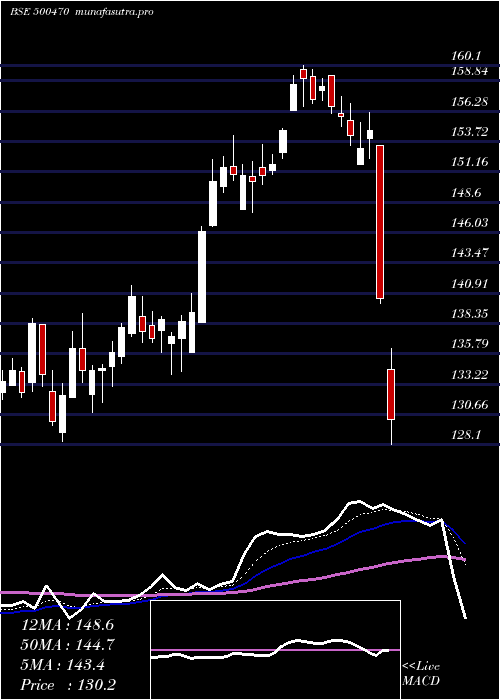
Daily price and volume Tata Steel
| Date |
Closing |
Open |
Range |
Volume |
Fri 05 December 2025 |
167.10 (0.21%) |
166.80 |
165.00 - 167.65 |
0.7156 times |
Thu 04 December 2025 |
166.75 (-0.09%) |
167.25 |
166.25 - 167.95 |
1.0649 times |
Wed 03 December 2025 |
166.90 (-0.51%) |
167.75 |
165.00 - 167.85 |
0.834 times |
Tue 02 December 2025 |
167.75 (-0.53%) |
168.15 |
167.05 - 168.90 |
0.5997 times |
Mon 01 December 2025 |
168.65 (0.48%) |
168.80 |
167.80 - 169.70 |
0.9092 times |
Fri 28 November 2025 |
167.85 (-0.15%) |
168.30 |
167.20 - 168.85 |
0.7583 times |
Thu 27 November 2025 |
168.10 (-0.97%) |
170.30 |
167.20 - 171.10 |
1.2067 times |
Wed 26 November 2025 |
169.75 (2.04%) |
166.65 |
166.65 - 170.00 |
1.9539 times |
Tue 25 November 2025 |
166.35 (0.64%) |
165.70 |
165.15 - 167.30 |
0.6394 times |
Mon 24 November 2025 |
165.30 (-1.61%) |
168.00 |
165.15 - 168.40 |
1.3184 times |
Fri 21 November 2025 |
168.00 (-2.58%) |
172.00 |
167.70 - 172.00 |
0.8027 times |
Weekly price and charts TataSteel Strong weekly Stock price targets for TataSteel 500470 are 163.7 and 168.4 | Weekly Target 1 | 162.57 | | Weekly Target 2 | 164.83 | | Weekly Target 3 | 167.26666666667 | | Weekly Target 4 | 169.53 | | Weekly Target 5 | 171.97 |
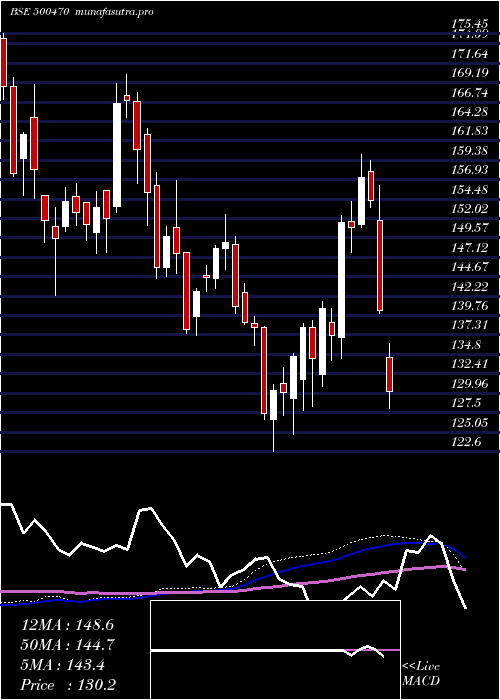
Weekly price and volumes for Tata Steel
| Date |
Closing |
Open |
Range |
Volume |
Fri 05 December 2025 |
167.10 (-0.45%) |
168.80 |
165.00 - 169.70 |
0.5398 times |
Fri 28 November 2025 |
167.85 (-0.09%) |
168.00 |
165.15 - 171.10 |
0.7693 times |
Fri 21 November 2025 |
168.00 (-3.53%) |
175.55 |
167.70 - 175.55 |
0.7379 times |
Fri 14 November 2025 |
174.15 (-4.02%) |
182.05 |
172.25 - 184.20 |
1.2292 times |
Fri 07 November 2025 |
181.45 (-0.82%) |
182.25 |
175.05 - 184.10 |
0.5703 times |
Fri 31 October 2025 |
182.95 (5.08%) |
175.40 |
175.40 - 187.00 |
1.6722 times |
Thu 23 October 2025 |
174.10 (1.07%) |
173.05 |
170.80 - 176.00 |
0.8079 times |
Fri 17 October 2025 |
172.25 (-0.89%) |
172.40 |
169.25 - 176.20 |
0.6753 times |
Fri 10 October 2025 |
173.80 (0.35%) |
172.85 |
169.30 - 177.85 |
2.0931 times |
Fri 03 October 2025 |
173.20 (3.43%) |
167.45 |
166.05 - 174.70 |
0.9049 times |
Fri 26 September 2025 |
167.45 (-2.36%) |
170.40 |
167.15 - 174.35 |
0.7999 times |
Monthly price and charts TataSteel Strong monthly Stock price targets for TataSteel 500470 are 163.7 and 168.4 | Monthly Target 1 | 162.57 | | Monthly Target 2 | 164.83 | | Monthly Target 3 | 167.26666666667 | | Monthly Target 4 | 169.53 | | Monthly Target 5 | 171.97 |
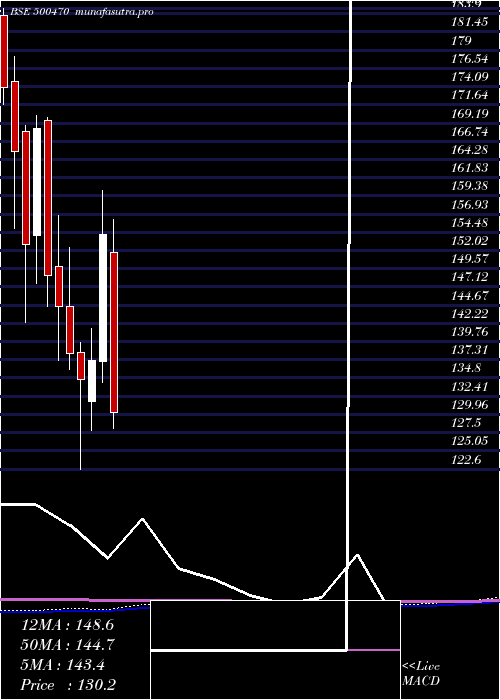
Monthly price and volumes Tata Steel
| Date |
Closing |
Open |
Range |
Volume |
Fri 05 December 2025 |
167.10 (-0.45%) |
168.80 |
165.00 - 169.70 |
0.1457 times |
Fri 28 November 2025 |
167.85 (-8.25%) |
182.25 |
165.15 - 184.20 |
0.8927 times |
Fri 31 October 2025 |
182.95 (8.45%) |
168.70 |
166.05 - 187.00 |
1.6044 times |
Tue 30 September 2025 |
168.70 (9.23%) |
154.30 |
153.90 - 174.35 |
1.2571 times |
Fri 29 August 2025 |
154.45 (-2.12%) |
157.80 |
152.55 - 162.70 |
0.7902 times |
Thu 31 July 2025 |
157.80 (-1.22%) |
160.35 |
156.50 - 168.75 |
0.9802 times |
Mon 30 June 2025 |
159.75 (-0.78%) |
158.05 |
149.70 - 163.35 |
0.8895 times |
Fri 30 May 2025 |
161.00 (15.21%) |
139.85 |
139.50 - 165.60 |
1.2895 times |
Wed 30 April 2025 |
139.75 (-9.4%) |
151.75 |
125.35 - 156.20 |
1.1266 times |
Fri 28 March 2025 |
154.25 (12.43%) |
137.05 |
134.30 - 160.10 |
1.0242 times |
Fri 28 February 2025 |
137.20 (1.89%) |
131.70 |
127.80 - 141.55 |
0.8798 times |
DMA SMA EMA moving averages of Tata Steel 500470
DMA (daily moving average) of Tata Steel 500470
| DMA period | DMA value | | 5 day DMA | 167.43 | | 12 day DMA | 167.91 | | 20 day DMA | 171.68 | | 35 day DMA | 174.07 | | 50 day DMA | 173.28 | | 100 day DMA | 167.62 | | 150 day DMA | 163.62 | | 200 day DMA | 158.34 | EMA (exponential moving average) of Tata Steel 500470
| EMA period | EMA current | EMA prev | EMA prev2 | | 5 day EMA | 167.33 | 167.45 | 167.8 | | 12 day EMA | 168.82 | 169.13 | 169.56 | | 20 day EMA | 170.43 | 170.78 | 171.2 | | 35 day EMA | 171.41 | 171.66 | 171.95 | | 50 day EMA | 172.53 | 172.75 | 172.99 |
SMA (simple moving average) of Tata Steel 500470
| SMA period | SMA current | SMA prev | SMA prev2 | | 5 day SMA | 167.43 | 167.58 | 167.85 | | 12 day SMA | 167.91 | 168.35 | 168.88 | | 20 day SMA | 171.68 | 172.19 | 172.82 | | 35 day SMA | 174.07 | 174.23 | 174.44 | | 50 day SMA | 173.28 | 173.37 | 173.48 | | 100 day SMA | 167.62 | 167.54 | 167.49 | | 150 day SMA | 163.62 | 163.46 | 163.27 | | 200 day SMA | 158.34 | 158.16 | 158 |
|
|
