Hindalco 500440 full analysis,charts,indicators,moving averages,SMA,DMA,EMA,ADX,MACD,RSIHindalco 500440 WideScreen charts, DMA,SMA,EMA technical analysis, forecast prediction, by indicators ADX,MACD,RSI,CCI BSE stock exchange
Daily price and charts and targets Hindalco Strong Daily Stock price targets for Hindalco 500440 are 815.68 and 839.03 | Daily Target 1 | 797.62 | | Daily Target 2 | 810.38 | | Daily Target 3 | 820.96666666667 | | Daily Target 4 | 833.73 | | Daily Target 5 | 844.32 |
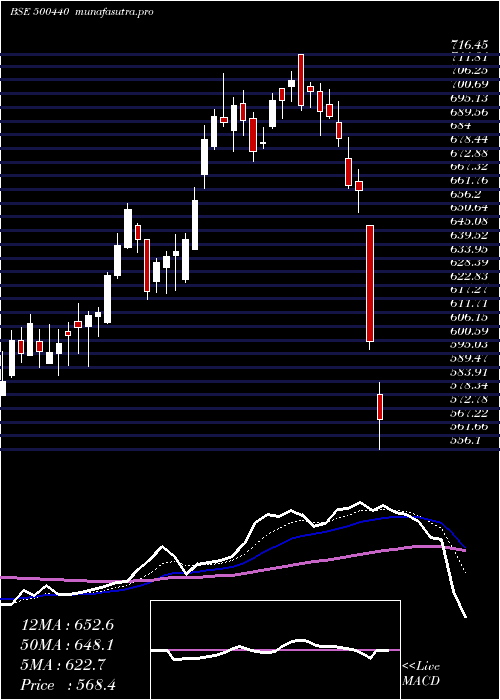
Daily price and volume Hindalco
| Date |
Closing |
Open |
Range |
Volume |
Fri 05 December 2025 |
823.15 (1.55%) |
812.85 |
808.20 - 831.55 |
1.1544 times |
Thu 04 December 2025 |
810.60 (-0.77%) |
822.75 |
809.00 - 826.50 |
0.7876 times |
Wed 03 December 2025 |
816.85 (1.32%) |
814.20 |
801.50 - 819.90 |
1.2347 times |
Tue 02 December 2025 |
806.20 (-0.61%) |
811.15 |
802.10 - 813.20 |
0.3255 times |
Mon 01 December 2025 |
811.15 (0.33%) |
808.85 |
808.25 - 817.75 |
0.3776 times |
Fri 28 November 2025 |
808.45 (0.14%) |
814.50 |
806.85 - 814.85 |
1.5005 times |
Thu 27 November 2025 |
807.30 (0.96%) |
808.70 |
800.30 - 814.00 |
0.6129 times |
Wed 26 November 2025 |
799.60 (1.4%) |
790.85 |
788.40 - 802.70 |
1.3208 times |
Tue 25 November 2025 |
788.55 (1.77%) |
780.40 |
773.80 - 791.60 |
1.7891 times |
Mon 24 November 2025 |
774.85 (-0.29%) |
780.40 |
772.25 - 788.00 |
0.8968 times |
Fri 21 November 2025 |
777.10 (-2.81%) |
788.00 |
776.05 - 788.00 |
1.5336 times |
Weekly price and charts Hindalco Strong weekly Stock price targets for Hindalco 500440 are 812.33 and 842.38 | Weekly Target 1 | 788.68 | | Weekly Target 2 | 805.92 | | Weekly Target 3 | 818.73333333333 | | Weekly Target 4 | 835.97 | | Weekly Target 5 | 848.78 |
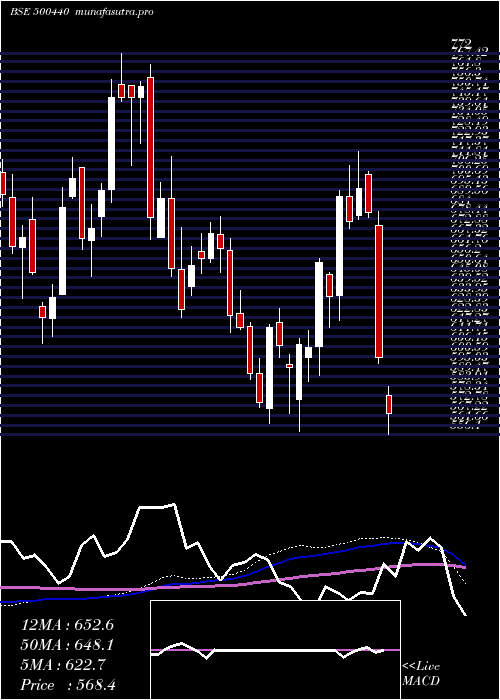
Weekly price and volumes for Hindalco
| Date |
Closing |
Open |
Range |
Volume |
Fri 05 December 2025 |
823.15 (1.82%) |
808.85 |
801.50 - 831.55 |
0.6335 times |
Fri 28 November 2025 |
808.45 (4.03%) |
780.40 |
772.25 - 814.85 |
0.9993 times |
Fri 21 November 2025 |
777.10 (-3.27%) |
803.65 |
776.05 - 818.30 |
0.8563 times |
Fri 14 November 2025 |
803.35 (1.64%) |
793.25 |
778.30 - 816.10 |
1.3645 times |
Fri 07 November 2025 |
790.40 (-6.76%) |
847.70 |
770.40 - 856.00 |
1.1617 times |
Fri 31 October 2025 |
847.70 (6.97%) |
832.00 |
827.45 - 863.80 |
1.9057 times |
Thu 23 October 2025 |
792.50 (2.61%) |
775.00 |
772.35 - 799.80 |
0.3687 times |
Fri 17 October 2025 |
772.35 (-0.19%) |
772.35 |
754.60 - 781.70 |
1.2003 times |
Fri 10 October 2025 |
773.80 (-0.83%) |
781.15 |
764.35 - 784.55 |
0.7649 times |
Fri 03 October 2025 |
780.25 (4.91%) |
744.10 |
744.10 - 790.95 |
0.7453 times |
Fri 26 September 2025 |
743.70 (0.07%) |
743.50 |
731.85 - 756.10 |
0.2208 times |
Monthly price and charts Hindalco Strong monthly Stock price targets for Hindalco 500440 are 812.33 and 842.38 | Monthly Target 1 | 788.68 | | Monthly Target 2 | 805.92 | | Monthly Target 3 | 818.73333333333 | | Monthly Target 4 | 835.97 | | Monthly Target 5 | 848.78 |
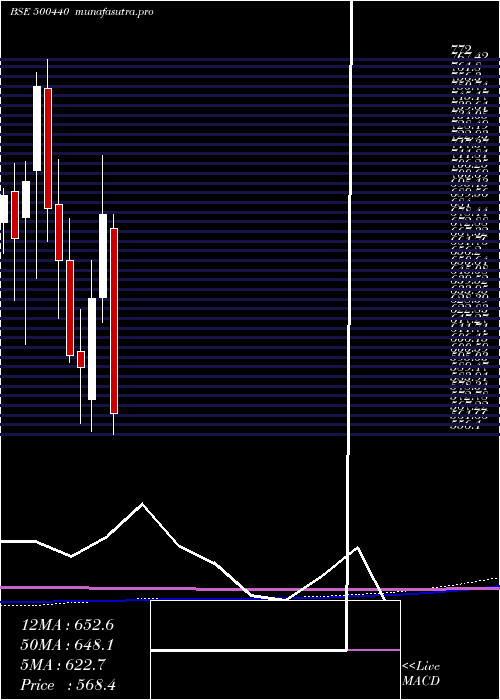
Monthly price and volumes Hindalco
| Date |
Closing |
Open |
Range |
Volume |
Fri 05 December 2025 |
823.15 (1.82%) |
808.85 |
801.50 - 831.55 |
0.2172 times |
Fri 28 November 2025 |
808.45 (-4.63%) |
847.70 |
770.40 - 856.00 |
1.5027 times |
Fri 31 October 2025 |
847.70 (11.27%) |
765.55 |
754.60 - 863.80 |
1.6559 times |
Tue 30 September 2025 |
761.85 (8.27%) |
707.80 |
703.00 - 769.00 |
0.5546 times |
Fri 29 August 2025 |
703.65 (3%) |
681.85 |
656.85 - 720.50 |
0.934 times |
Thu 31 July 2025 |
683.15 (-1.43%) |
691.25 |
662.80 - 708.30 |
0.8688 times |
Mon 30 June 2025 |
693.05 (9.43%) |
630.95 |
617.90 - 700.15 |
1.0301 times |
Fri 30 May 2025 |
633.35 (1.56%) |
624.05 |
602.10 - 671.50 |
1.3037 times |
Wed 30 April 2025 |
623.65 (-8.6%) |
674.50 |
552.50 - 682.70 |
1.1582 times |
Fri 28 March 2025 |
682.35 (7.57%) |
635.05 |
620.70 - 716.45 |
0.7748 times |
Fri 28 February 2025 |
634.35 (6.71%) |
575.95 |
558.00 - 655.95 |
1.1149 times |
DMA SMA EMA moving averages of Hindalco 500440
DMA (daily moving average) of Hindalco 500440
| DMA period | DMA value | | 5 day DMA | 813.59 | | 12 day DMA | 801.95 | | 20 day DMA | 800.34 | | 35 day DMA | 804.8 | | 50 day DMA | 791.64 | | 100 day DMA | 748.23 | | 150 day DMA | 717.22 | | 200 day DMA | 697.8 | EMA (exponential moving average) of Hindalco 500440
| EMA period | EMA current | EMA prev | EMA prev2 | | 5 day EMA | 814 | 809.43 | 808.85 | | 12 day EMA | 807.85 | 805.07 | 804.07 | | 20 day EMA | 804.85 | 802.92 | 802.11 | | 35 day EMA | 795.74 | 794.13 | 793.16 | | 50 day EMA | 790.49 | 789.16 | 788.29 |
SMA (simple moving average) of Hindalco 500440
| SMA period | SMA current | SMA prev | SMA prev2 | | 5 day SMA | 813.59 | 810.65 | 809.99 | | 12 day SMA | 801.95 | 799.79 | 799.51 | | 20 day SMA | 800.34 | 798.59 | 799.6 | | 35 day SMA | 804.8 | 803.28 | 802.23 | | 50 day SMA | 791.64 | 790.04 | 788.83 | | 100 day SMA | 748.23 | 746.74 | 745.49 | | 150 day SMA | 717.22 | 715.92 | 714.66 | | 200 day SMA | 697.8 | 696.56 | 695.48 |
|
|
