ThomasCook 500413 full analysis,charts,indicators,moving averages,SMA,DMA,EMA,ADX,MACD,RSIThomas Cook 500413 WideScreen charts, DMA,SMA,EMA technical analysis, forecast prediction, by indicators ADX,MACD,RSI,CCI BSE stock exchange
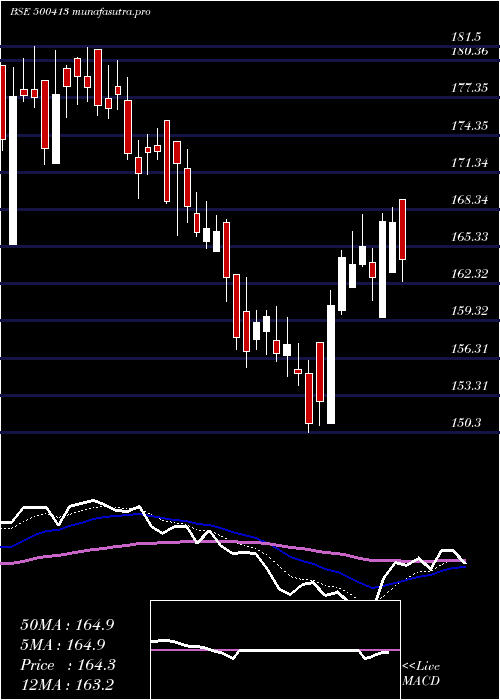
Daily price and charts and targets ThomasCook Strong Daily Stock price targets for ThomasCook 500413 are 160.1 and 166.7 | Daily Target 1 | 158.7 | | Daily Target 2 | 161.5 | | Daily Target 3 | 165.3 | | Daily Target 4 | 168.1 | | Daily Target 5 | 171.9 |
Daily price and volume Thomas Cook
| Date |
Closing |
Open |
Range |
Volume |
Thu 23 October 2025 |
164.30 (-1.76%) |
169.10 |
162.50 - 169.10 |
0.0701 times |
Tue 21 October 2025 |
167.25 (-0.06%) |
163.25 |
163.25 - 168.50 |
0.1447 times |
Mon 20 October 2025 |
167.35 (2.79%) |
159.60 |
159.60 - 168.00 |
0.1592 times |
Fri 17 October 2025 |
162.80 (-1.51%) |
164.05 |
161.00 - 165.20 |
0.0495 times |
Thu 16 October 2025 |
165.30 (0.88%) |
163.90 |
163.70 - 167.90 |
0.2559 times |
Wed 15 October 2025 |
163.85 (-0.33%) |
162.00 |
162.00 - 166.55 |
0.096 times |
Tue 14 October 2025 |
164.40 (2.37%) |
160.20 |
159.85 - 165.05 |
0.426 times |
Mon 13 October 2025 |
160.60 (5.1%) |
151.05 |
151.05 - 161.75 |
0.5468 times |
Fri 10 October 2025 |
152.80 (1.19%) |
157.55 |
150.85 - 157.55 |
1.0733 times |
Thu 09 October 2025 |
151.00 (-2.61%) |
155.05 |
150.30 - 156.10 |
7.1785 times |
Wed 08 October 2025 |
155.05 (-1.49%) |
155.40 |
154.10 - 157.45 |
0.1898 times |
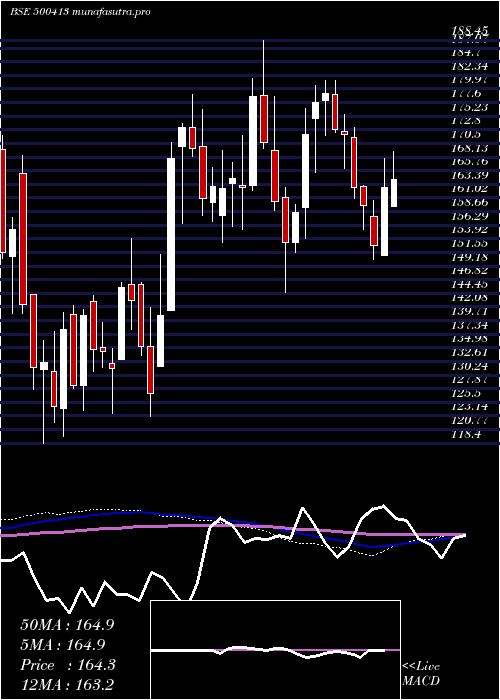
Weekly price and charts ThomasCook Strong weekly Stock price targets for ThomasCook 500413 are 161.95 and 171.45 | Weekly Target 1 | 154.83 | | Weekly Target 2 | 159.57 | | Weekly Target 3 | 164.33333333333 | | Weekly Target 4 | 169.07 | | Weekly Target 5 | 173.83 |
Weekly price and volumes for Thomas Cook
| Date |
Closing |
Open |
Range |
Volume |
Thu 23 October 2025 |
164.30 (0.92%) |
159.60 |
159.60 - 169.10 |
0.1446 times |
Fri 17 October 2025 |
162.80 (6.54%) |
151.05 |
151.05 - 167.90 |
0.5311 times |
Fri 10 October 2025 |
152.80 (-4.32%) |
157.75 |
150.30 - 160.50 |
6.6406 times |
Fri 03 October 2025 |
159.70 (-1.93%) |
163.05 |
155.55 - 163.10 |
0.2504 times |
Fri 26 September 2025 |
162.85 (-5.35%) |
171.60 |
160.90 - 173.20 |
0.1713 times |
Fri 19 September 2025 |
172.05 (-0.46%) |
172.55 |
166.20 - 175.50 |
0.3062 times |
Fri 12 September 2025 |
172.85 (-3.49%) |
179.05 |
172.35 - 181.40 |
0.3237 times |
Fri 05 September 2025 |
179.10 (0.87%) |
178.00 |
171.95 - 181.50 |
0.5772 times |
Fri 29 August 2025 |
177.55 (3.23%) |
174.80 |
165.50 - 180.55 |
0.3284 times |
Fri 22 August 2025 |
172.00 (8.55%) |
159.35 |
154.00 - 176.55 |
0.7266 times |
Thu 14 August 2025 |
158.45 (3.33%) |
153.30 |
151.60 - 159.95 |
0.2892 times |
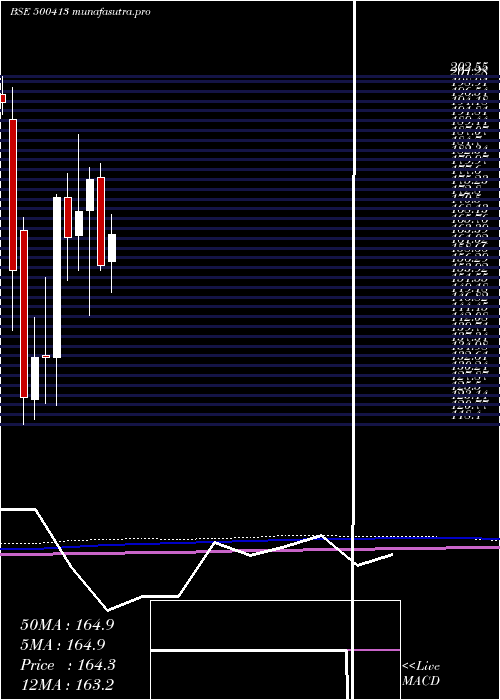
Monthly price and charts ThomasCook Strong monthly Stock price targets for ThomasCook 500413 are 157.3 and 176.1 | Monthly Target 1 | 142.43 | | Monthly Target 2 | 153.37 | | Monthly Target 3 | 161.23333333333 | | Monthly Target 4 | 172.17 | | Monthly Target 5 | 180.03 |
Monthly price and volumes Thomas Cook
| Date |
Closing |
Open |
Range |
Volume |
Thu 23 October 2025 |
164.30 (4.75%) |
157.85 |
150.30 - 169.10 |
2.4714 times |
Tue 30 September 2025 |
156.85 (-11.66%) |
178.00 |
155.55 - 181.50 |
0.5116 times |
Fri 29 August 2025 |
177.55 (4.56%) |
170.00 |
144.60 - 180.55 |
0.8742 times |
Thu 31 July 2025 |
169.80 (3.85%) |
164.15 |
155.55 - 188.45 |
1.5073 times |
Mon 30 June 2025 |
163.50 (-5.6%) |
173.35 |
153.20 - 179.00 |
0.7711 times |
Fri 30 May 2025 |
173.20 (28.73%) |
134.60 |
123.05 - 174.00 |
1.1475 times |
Wed 30 April 2025 |
134.55 (-0.04%) |
135.00 |
123.55 - 153.95 |
0.48 times |
Fri 28 March 2025 |
134.60 (7.81%) |
124.50 |
119.50 - 144.15 |
0.6404 times |
Fri 28 February 2025 |
124.85 (-19.76%) |
165.25 |
118.40 - 168.40 |
1.0501 times |
Fri 31 January 2025 |
155.60 (-20.71%) |
192.00 |
141.00 - 199.75 |
0.5464 times |
Tue 31 December 2024 |
196.25 (-5.88%) |
208.50 |
193.20 - 225.45 |
0.352 times |
DMA SMA EMA moving averages of Thomas Cook 500413
DMA (daily moving average) of Thomas Cook 500413
| DMA period | DMA value | | 5 day DMA | 165.4 | | 12 day DMA | 161.01 | | 20 day DMA | 160.93 | | 35 day DMA | 166.54 | | 50 day DMA | 167.18 | | 100 day DMA | 166.73 | | 150 day DMA | 158.18 | | 200 day DMA | 157.42 | EMA (exponential moving average) of Thomas Cook 500413
| EMA period | EMA current | EMA prev | EMA prev2 | | 5 day EMA | 164.85 | 165.12 | 164.06 | | 12 day EMA | 163.2 | 163 | 162.23 | | 20 day EMA | 163.2 | 163.08 | 162.64 | | 35 day EMA | 163.81 | 163.78 | 163.58 | | 50 day EMA | 165.9 | 165.97 | 165.92 |
SMA (simple moving average) of Thomas Cook 500413
| SMA period | SMA current | SMA prev | SMA prev2 | | 5 day SMA | 165.4 | 165.31 | 164.74 | | 12 day SMA | 161.01 | 160.37 | 159.74 | | 20 day SMA | 160.93 | 161.04 | 161.11 | | 35 day SMA | 166.54 | 166.79 | 167.08 | | 50 day SMA | 167.18 | 166.96 | 166.7 | | 100 day SMA | 166.73 | 166.69 | 166.64 | | 150 day SMA | 158.18 | 158.01 | 157.78 | | 200 day SMA | 157.42 | 157.59 | 157.74 |
|
|
