Thirumalai 500412 full analysis,charts,indicators,moving averages,SMA,DMA,EMA,ADX,MACD,RSIThirumalai 500412 WideScreen charts, DMA,SMA,EMA technical analysis, forecast prediction, by indicators ADX,MACD,RSI,CCI BSE stock exchange
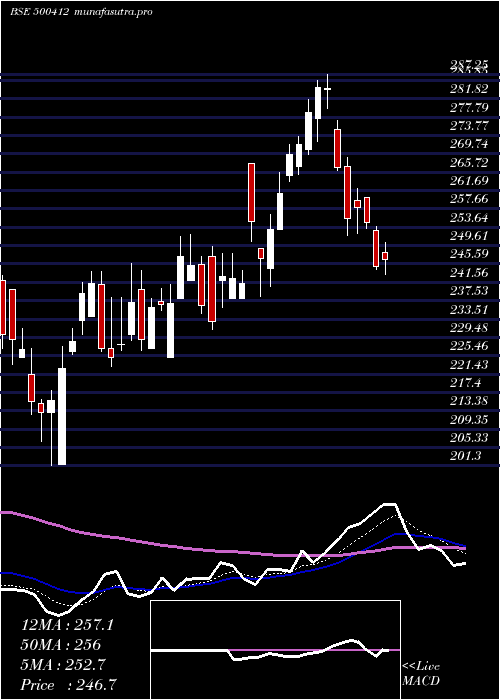
Daily price and charts and targets Thirumalai Strong Daily Stock price targets for Thirumalai 500412 are 278.95 and 283.8 | Daily Target 1 | 275.18 | | Daily Target 2 | 277.87 | | Daily Target 3 | 280.03333333333 | | Daily Target 4 | 282.72 | | Daily Target 5 | 284.88 |
Daily price and volume Thirumalai
| Date |
Closing |
Open |
Range |
Volume |
Tue 21 October 2025 |
280.55 (1.25%) |
277.35 |
277.35 - 282.20 |
0.2799 times |
Mon 20 October 2025 |
277.10 (0.38%) |
273.05 |
273.05 - 283.00 |
0.694 times |
Fri 17 October 2025 |
276.05 (-0.56%) |
276.40 |
273.75 - 277.85 |
0.779 times |
Thu 16 October 2025 |
277.60 (0.18%) |
277.30 |
275.30 - 282.25 |
0.7263 times |
Wed 15 October 2025 |
277.10 (1.13%) |
274.90 |
273.25 - 279.05 |
0.7889 times |
Tue 14 October 2025 |
274.00 (-1.99%) |
275.15 |
273.00 - 289.10 |
1.4165 times |
Mon 13 October 2025 |
279.55 (0.56%) |
278.00 |
275.00 - 280.70 |
1.3796 times |
Fri 10 October 2025 |
278.00 (-0.5%) |
279.95 |
277.40 - 283.05 |
0.9401 times |
Thu 09 October 2025 |
279.40 (-1.01%) |
280.85 |
278.50 - 283.75 |
1.5904 times |
Wed 08 October 2025 |
282.25 (-0.11%) |
282.30 |
280.25 - 286.00 |
1.4052 times |
Tue 07 October 2025 |
282.55 (-0.3%) |
284.85 |
281.15 - 285.40 |
0.4711 times |
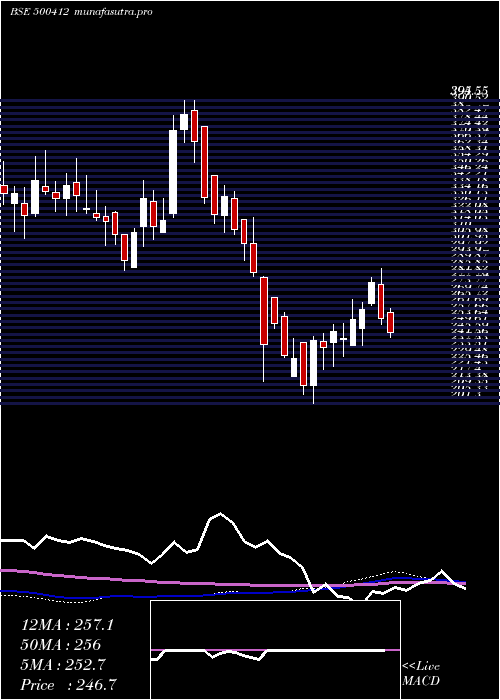
Weekly price and charts Thirumalai Strong weekly Stock price targets for Thirumalai 500412 are 276.8 and 286.75 | Weekly Target 1 | 268.92 | | Weekly Target 2 | 274.73 | | Weekly Target 3 | 278.86666666667 | | Weekly Target 4 | 284.68 | | Weekly Target 5 | 288.82 |
Weekly price and volumes for Thirumalai
| Date |
Closing |
Open |
Range |
Volume |
Tue 21 October 2025 |
280.55 (1.63%) |
273.05 |
273.05 - 283.00 |
0.0775 times |
Fri 17 October 2025 |
276.05 (-0.7%) |
278.00 |
273.00 - 289.10 |
0.4049 times |
Fri 10 October 2025 |
278.00 (-2.27%) |
282.00 |
277.40 - 286.85 |
0.4139 times |
Fri 03 October 2025 |
284.45 (-2.69%) |
303.85 |
275.60 - 303.85 |
0.489 times |
Fri 26 September 2025 |
292.30 (-9.87%) |
327.00 |
285.60 - 327.00 |
0.9654 times |
Fri 19 September 2025 |
324.30 (2.97%) |
314.95 |
313.10 - 328.70 |
1.3452 times |
Fri 12 September 2025 |
314.95 (2.98%) |
305.90 |
298.70 - 323.65 |
1.6774 times |
Fri 05 September 2025 |
305.85 (4.99%) |
293.45 |
291.35 - 314.00 |
2.2337 times |
Fri 29 August 2025 |
291.30 (3.13%) |
287.80 |
279.30 - 304.85 |
1.1649 times |
Fri 22 August 2025 |
282.45 (-0.95%) |
273.25 |
273.25 - 301.95 |
1.228 times |
Thu 14 August 2025 |
285.15 (-1.23%) |
293.90 |
282.80 - 293.90 |
0.2237 times |
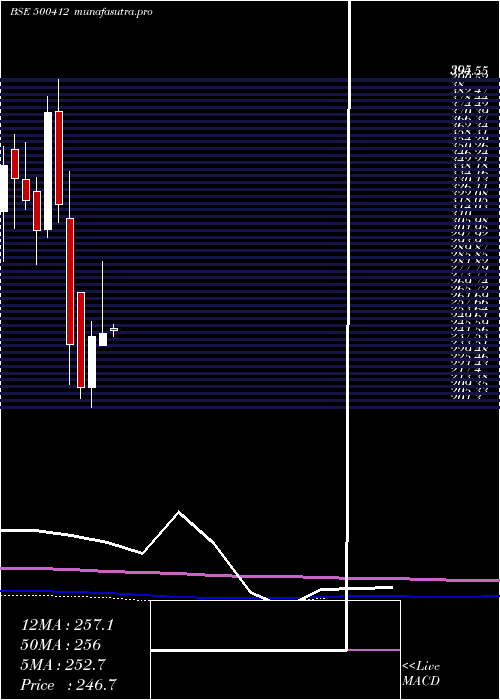
Monthly price and charts Thirumalai Strong monthly Stock price targets for Thirumalai 500412 are 276.78 and 292.88 | Monthly Target 1 | 264.78 | | Monthly Target 2 | 272.67 | | Monthly Target 3 | 280.88333333333 | | Monthly Target 4 | 288.77 | | Monthly Target 5 | 296.98 |
Monthly price and volumes Thirumalai
| Date |
Closing |
Open |
Range |
Volume |
Tue 21 October 2025 |
280.55 (-0.14%) |
275.60 |
273.00 - 289.10 |
0.2082 times |
Tue 30 September 2025 |
280.95 (-3.55%) |
293.45 |
276.85 - 328.70 |
1.2205 times |
Fri 29 August 2025 |
291.30 (-2.48%) |
302.00 |
273.25 - 304.85 |
0.7359 times |
Thu 31 July 2025 |
298.70 (1.69%) |
296.90 |
278.50 - 318.40 |
1.5216 times |
Mon 30 June 2025 |
293.75 (17.95%) |
249.30 |
247.35 - 301.20 |
2.1027 times |
Fri 30 May 2025 |
249.05 (1.67%) |
248.10 |
233.35 - 276.95 |
0.9626 times |
Wed 30 April 2025 |
244.95 (0.86%) |
238.00 |
238.00 - 287.25 |
0.4539 times |
Fri 28 March 2025 |
242.85 (14.04%) |
213.00 |
201.30 - 252.10 |
1.0048 times |
Fri 28 February 2025 |
212.95 (-10.77%) |
269.25 |
206.70 - 269.25 |
0.6753 times |
Fri 31 January 2025 |
238.65 (-25.69%) |
313.05 |
215.00 - 340.55 |
1.1143 times |
Tue 31 December 2024 |
321.15 (-14.51%) |
376.10 |
310.55 - 395.00 |
1.4459 times |
DMA SMA EMA moving averages of Thirumalai 500412
DMA (daily moving average) of Thirumalai 500412
| DMA period | DMA value | | 5 day DMA | 277.68 | | 12 day DMA | 278.96 | | 20 day DMA | 284.6 | | 35 day DMA | 297.09 | | 50 day DMA | 294.3 | | 100 day DMA | 290.84 | | 150 day DMA | 277.08 | | 200 day DMA | 276.18 | EMA (exponential moving average) of Thirumalai 500412
| EMA period | EMA current | EMA prev | EMA prev2 | | 5 day EMA | 278.31 | 277.19 | 277.24 | | 12 day EMA | 280.74 | 280.77 | 281.44 | | 20 day EMA | 284.83 | 285.28 | 286.14 | | 35 day EMA | 287.48 | 287.89 | 288.53 | | 50 day EMA | 292.05 | 292.52 | 293.15 |
SMA (simple moving average) of Thirumalai 500412
| SMA period | SMA current | SMA prev | SMA prev2 | | 5 day SMA | 277.68 | 276.37 | 276.86 | | 12 day SMA | 278.96 | 279.29 | 280.09 | | 20 day SMA | 284.6 | 286.64 | 289 | | 35 day SMA | 297.09 | 297.49 | 297.89 | | 50 day SMA | 294.3 | 294.39 | 294.57 | | 100 day SMA | 290.84 | 290.5 | 290.23 | | 150 day SMA | 277.08 | 276.73 | 276.37 | | 200 day SMA | 276.18 | 276.39 | 276.67 |
|
|
