TataPower 500400 full analysis,charts,indicators,moving averages,SMA,DMA,EMA,ADX,MACD,RSITata Power 500400 WideScreen charts, DMA,SMA,EMA technical analysis, forecast prediction, by indicators ADX,MACD,RSI,CCI BSE stock exchange
Daily price and charts and targets TataPower Strong Daily Stock price targets for TataPower 500400 are 398.05 and 401.65 | Daily Target 1 | 395.52 | | Daily Target 2 | 396.98 | | Daily Target 3 | 399.11666666667 | | Daily Target 4 | 400.58 | | Daily Target 5 | 402.72 |
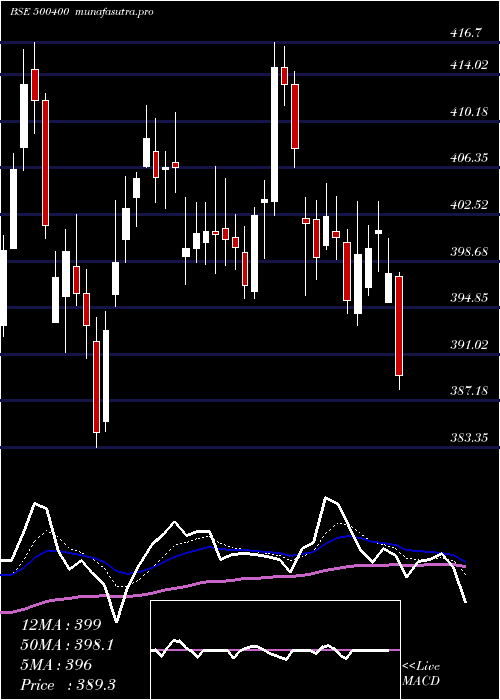
Daily price and volume Tata Power
| Date |
Closing |
Open |
Range |
Volume |
Tue 21 October 2025 |
398.45 (-0.3%) |
398.40 |
397.65 - 401.25 |
0.1492 times |
Mon 20 October 2025 |
399.65 (0.48%) |
397.35 |
396.65 - 400.80 |
0.3664 times |
Fri 17 October 2025 |
397.75 (-0.3%) |
398.90 |
394.55 - 400.60 |
1.8245 times |
Thu 16 October 2025 |
398.95 (0.66%) |
396.35 |
396.35 - 402.85 |
0.5448 times |
Wed 15 October 2025 |
396.35 (1.3%) |
391.15 |
391.15 - 397.20 |
0.7805 times |
Tue 14 October 2025 |
391.25 (0.03%) |
390.70 |
387.70 - 393.40 |
1.1297 times |
Mon 13 October 2025 |
391.15 (0.28%) |
387.65 |
385.25 - 392.00 |
1.4219 times |
Fri 10 October 2025 |
390.05 (0.45%) |
393.00 |
389.55 - 396.70 |
2.0515 times |
Thu 09 October 2025 |
388.30 (0.75%) |
386.15 |
381.60 - 389.20 |
1.1869 times |
Wed 08 October 2025 |
385.40 (-1.75%) |
391.10 |
384.25 - 393.15 |
0.5446 times |
Tue 07 October 2025 |
392.25 (-0.83%) |
395.15 |
391.50 - 397.15 |
0.9269 times |
Weekly price and charts TataPower Strong weekly Stock price targets for TataPower 500400 are 397.55 and 402.15 | Weekly Target 1 | 394.18 | | Weekly Target 2 | 396.32 | | Weekly Target 3 | 398.78333333333 | | Weekly Target 4 | 400.92 | | Weekly Target 5 | 403.38 |
Weekly price and volumes for Tata Power
| Date |
Closing |
Open |
Range |
Volume |
Tue 21 October 2025 |
398.45 (0.18%) |
397.35 |
396.65 - 401.25 |
0.1445 times |
Fri 17 October 2025 |
397.75 (1.97%) |
387.65 |
385.25 - 402.85 |
1.5986 times |
Fri 10 October 2025 |
390.05 (-1.22%) |
393.15 |
381.60 - 397.15 |
1.8482 times |
Fri 03 October 2025 |
394.85 (2.87%) |
380.05 |
380.05 - 395.35 |
0.9633 times |
Fri 26 September 2025 |
383.85 (-3.12%) |
396.00 |
382.30 - 399.95 |
0.9179 times |
Fri 19 September 2025 |
396.20 (2.58%) |
385.65 |
385.65 - 399.90 |
1.5744 times |
Fri 12 September 2025 |
386.25 (0.14%) |
384.45 |
381.05 - 390.85 |
0.8534 times |
Fri 05 September 2025 |
385.70 (3.1%) |
373.75 |
373.75 - 391.95 |
0.72 times |
Fri 29 August 2025 |
374.10 (-2.98%) |
385.65 |
368.65 - 388.35 |
0.8045 times |
Fri 22 August 2025 |
385.60 (0.12%) |
389.95 |
384.50 - 392.40 |
0.5751 times |
Thu 14 August 2025 |
385.15 (1.64%) |
378.95 |
377.50 - 388.85 |
0.6122 times |

Monthly price and charts TataPower Strong monthly Stock price targets for TataPower 500400 are 390.03 and 411.28 | Monthly Target 1 | 373.05 | | Monthly Target 2 | 385.75 | | Monthly Target 3 | 394.3 | | Monthly Target 4 | 407 | | Monthly Target 5 | 415.55 |
Monthly price and volumes Tata Power
| Date |
Closing |
Open |
Range |
Volume |
Tue 21 October 2025 |
398.45 (2.5%) |
386.70 |
381.60 - 402.85 |
0.7672 times |
Tue 30 September 2025 |
388.75 (3.92%) |
373.75 |
373.75 - 399.95 |
0.8354 times |
Fri 29 August 2025 |
374.10 (-5.93%) |
397.40 |
368.65 - 397.75 |
0.8156 times |
Thu 31 July 2025 |
397.70 (-1.95%) |
406.20 |
393.40 - 416.70 |
0.8575 times |
Mon 30 June 2025 |
405.60 (3.27%) |
392.70 |
383.35 - 416.70 |
0.8837 times |
Fri 30 May 2025 |
392.75 (2.23%) |
383.10 |
357.55 - 412.00 |
1.187 times |
Wed 30 April 2025 |
384.20 (2.34%) |
372.95 |
354.00 - 403.35 |
1.0519 times |
Fri 28 March 2025 |
375.40 (10.7%) |
338.55 |
332.00 - 386.00 |
0.8329 times |
Fri 28 February 2025 |
339.10 (-6.9%) |
367.35 |
326.25 - 375.00 |
1.1718 times |
Fri 31 January 2025 |
364.25 (-7.17%) |
393.00 |
338.50 - 402.90 |
1.597 times |
Tue 31 December 2024 |
392.40 (-5.23%) |
413.85 |
385.45 - 447.70 |
1.5369 times |

DMA SMA EMA moving averages of Tata Power 500400
DMA (daily moving average) of Tata Power 500400
| DMA period | DMA value | | 5 day DMA | 398.23 | | 12 day DMA | 393.76 | | 20 day DMA | 392.15 | | 35 day DMA | 390.82 | | 50 day DMA | 388.52 | | 100 day DMA | 393.93 | | 150 day DMA | 389.27 | | 200 day DMA | 382.68 | EMA (exponential moving average) of Tata Power 500400
| EMA period | EMA current | EMA prev | EMA prev2 | | 5 day EMA | 397.48 | 397 | 395.68 | | 12 day EMA | 394.91 | 394.27 | 393.29 | | 20 day EMA | 393.28 | 392.74 | 392.01 | | 35 day EMA | 390.93 | 390.49 | 389.95 | | 50 day EMA | 389.33 | 388.96 | 388.52 |
SMA (simple moving average) of Tata Power 500400
| SMA period | SMA current | SMA prev | SMA prev2 | | 5 day SMA | 398.23 | 396.79 | 395.09 | | 12 day SMA | 393.76 | 393.46 | 392.74 | | 20 day SMA | 392.15 | 391.99 | 391.82 | | 35 day SMA | 390.82 | 390.3 | 389.57 | | 50 day SMA | 388.52 | 388.26 | 387.98 | | 100 day SMA | 393.93 | 393.91 | 393.94 | | 150 day SMA | 389.27 | 388.96 | 388.6 | | 200 day SMA | 382.68 | 382.68 | 382.69 |
|
|
