Rswm 500350 full analysis,charts,indicators,moving averages,SMA,DMA,EMA,ADX,MACD,RSIRswm 500350 WideScreen charts, DMA,SMA,EMA technical analysis, forecast prediction, by indicators ADX,MACD,RSI,CCI BSE stock exchange
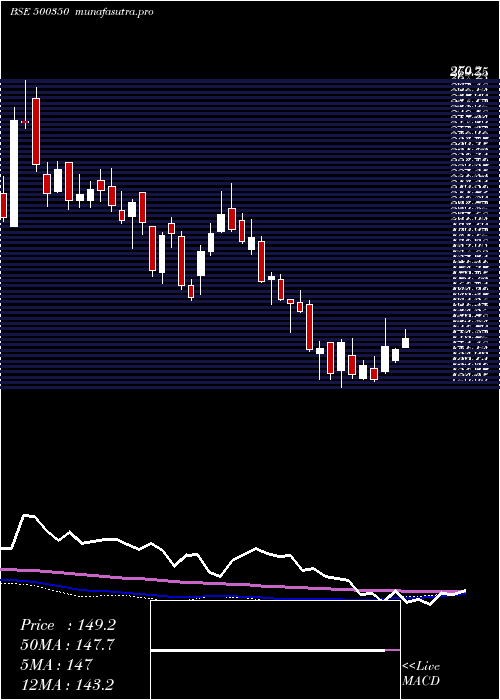
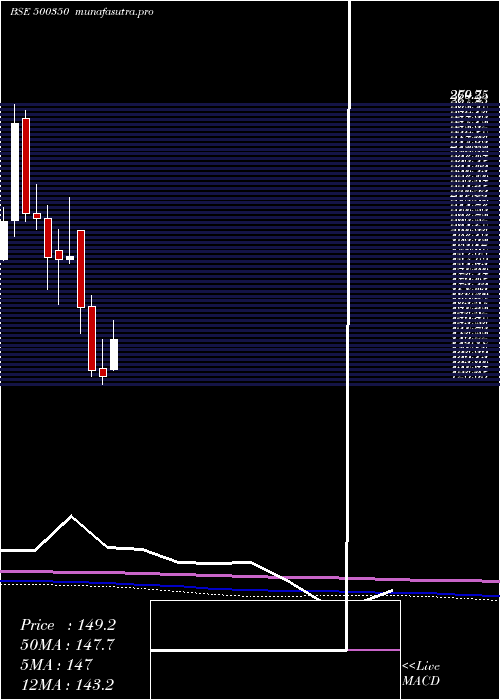
Daily price and charts and targets Rswm Strong Daily Stock price targets for Rswm 500350 are 145.83 and 149.63 | Daily Target 1 | 142.9 | | Daily Target 2 | 144.95 | | Daily Target 3 | 146.7 | | Daily Target 4 | 148.75 | | Daily Target 5 | 150.5 |
Daily price and volume Rswm
| Date |
Closing |
Open |
Range |
Volume |
Thu 23 October 2025 |
147.00 (1.8%) |
145.80 |
144.65 - 148.45 |
1.3312 times |
Tue 21 October 2025 |
144.40 (1.23%) |
144.40 |
144.00 - 144.45 |
0.3276 times |
Mon 20 October 2025 |
142.65 (1.71%) |
156.95 |
140.70 - 156.95 |
0.3179 times |
Fri 17 October 2025 |
140.25 (-4.2%) |
146.50 |
137.10 - 146.50 |
2.0225 times |
Thu 16 October 2025 |
146.40 (3.06%) |
143.05 |
143.05 - 147.40 |
1.0181 times |
Wed 15 October 2025 |
142.05 (0.64%) |
141.40 |
140.60 - 142.30 |
1.5453 times |
Tue 14 October 2025 |
141.15 (-1.05%) |
141.55 |
140.95 - 143.00 |
1.9646 times |
Mon 13 October 2025 |
142.65 (-0.94%) |
141.40 |
141.05 - 144.70 |
0.3557 times |
Fri 10 October 2025 |
144.00 (0.66%) |
144.30 |
143.00 - 144.30 |
0.2245 times |
Thu 09 October 2025 |
143.05 (0.14%) |
142.70 |
141.40 - 144.05 |
0.8926 times |
Wed 08 October 2025 |
142.85 (-0.42%) |
145.35 |
142.65 - 146.15 |
0.3622 times |

Weekly price and charts Rswm Strong weekly Stock price targets for Rswm 500350 are 135.73 and 151.98 | Weekly Target 1 | 131.97 | | Weekly Target 2 | 139.48 | | Weekly Target 3 | 148.21666666667 | | Weekly Target 4 | 155.73 | | Weekly Target 5 | 164.47 |
Weekly price and volumes for Rswm
| Date |
Closing |
Open |
Range |
Volume |
Thu 23 October 2025 |
147.00 (4.81%) |
156.95 |
140.70 - 156.95 |
0.2061 times |
Fri 17 October 2025 |
140.25 (-2.6%) |
141.40 |
137.10 - 147.40 |
0.7202 times |
Fri 10 October 2025 |
144.00 (-2.21%) |
144.85 |
141.40 - 149.95 |
0.4302 times |
Fri 03 October 2025 |
147.25 (-0.24%) |
149.80 |
145.15 - 161.35 |
0.671 times |
Fri 26 September 2025 |
147.60 (-7.87%) |
160.25 |
145.25 - 161.10 |
0.8985 times |
Fri 19 September 2025 |
160.20 (-0.74%) |
158.00 |
156.15 - 165.85 |
1.2311 times |
Fri 12 September 2025 |
161.40 (4.84%) |
154.55 |
154.30 - 169.50 |
1.8031 times |
Fri 05 September 2025 |
153.95 (4.13%) |
146.00 |
146.00 - 160.00 |
2.9753 times |
Fri 29 August 2025 |
147.85 (-5.53%) |
156.40 |
146.85 - 157.95 |
0.4513 times |
Fri 22 August 2025 |
156.50 (2.49%) |
154.95 |
150.00 - 159.40 |
0.6132 times |
Thu 14 August 2025 |
152.70 (0.83%) |
154.00 |
145.85 - 156.00 |
0.6452 times |
Monthly price and charts Rswm Strong monthly Stock price targets for Rswm 500350 are 134.88 and 159.13 | Monthly Target 1 | 124.23 | | Monthly Target 2 | 135.62 | | Monthly Target 3 | 148.48333333333 | | Monthly Target 4 | 159.87 | | Monthly Target 5 | 172.73 |
Monthly price and volumes Rswm
| Date |
Closing |
Open |
Range |
Volume |
Thu 23 October 2025 |
147.00 (0.07%) |
147.00 |
137.10 - 161.35 |
0.1766 times |
Tue 30 September 2025 |
146.90 (-0.64%) |
146.00 |
145.25 - 169.50 |
0.8216 times |
Fri 29 August 2025 |
147.85 (-6.45%) |
171.00 |
145.85 - 171.00 |
0.4297 times |
Thu 31 July 2025 |
158.05 (-10.17%) |
174.85 |
157.30 - 188.70 |
0.5635 times |
Mon 30 June 2025 |
175.95 (0.34%) |
173.80 |
161.90 - 191.00 |
0.8844 times |
Fri 30 May 2025 |
175.35 (21.27%) |
146.80 |
140.00 - 178.00 |
1.1235 times |
Wed 30 April 2025 |
144.60 (11.23%) |
133.65 |
132.95 - 163.50 |
1.1233 times |
Fri 28 March 2025 |
130.00 (-2.18%) |
134.10 |
126.05 - 149.10 |
3.169 times |
Fri 28 February 2025 |
132.90 (-19.77%) |
166.00 |
129.80 - 171.80 |
1.0023 times |
Fri 31 January 2025 |
165.65 (-13.52%) |
205.00 |
152.00 - 205.00 |
0.7061 times |
Tue 31 December 2024 |
191.55 (0.79%) |
190.15 |
187.95 - 222.00 |
1.1909 times |
DMA SMA EMA moving averages of Rswm 500350
DMA (daily moving average) of Rswm 500350
| DMA period | DMA value | | 5 day DMA | 144.14 | | 12 day DMA | 143.33 | | 20 day DMA | 145.63 | | 35 day DMA | 151.08 | | 50 day DMA | 151.95 | | 100 day DMA | 160.56 | | 150 day DMA | 156.77 | | 200 day DMA | 158.5 | EMA (exponential moving average) of Rswm 500350
| EMA period | EMA current | EMA prev | EMA prev2 | | 5 day EMA | 144.49 | 143.24 | 142.66 | | 12 day EMA | 144.71 | 144.29 | 144.27 | | 20 day EMA | 146.29 | 146.21 | 146.4 | | 35 day EMA | 148.27 | 148.34 | 148.57 | | 50 day EMA | 151.15 | 151.32 | 151.6 |
SMA (simple moving average) of Rswm 500350
| SMA period | SMA current | SMA prev | SMA prev2 | | 5 day SMA | 144.14 | 143.15 | 142.5 | | 12 day SMA | 143.33 | 143.25 | 143.48 | | 20 day SMA | 145.63 | 146.14 | 146.87 | | 35 day SMA | 151.08 | 151.36 | 151.79 | | 50 day SMA | 151.95 | 152.03 | 152.19 | | 100 day SMA | 160.56 | 160.83 | 161.13 | | 150 day SMA | 156.77 | 156.73 | 156.69 | | 200 day SMA | 158.5 | 158.76 | 159.04 |
|
|
