OngcCorpn 500312 full analysis,charts,indicators,moving averages,SMA,DMA,EMA,ADX,MACD,RSIOngc Corpn 500312 WideScreen charts, DMA,SMA,EMA technical analysis, forecast prediction, by indicators ADX,MACD,RSI,CCI BSE stock exchange
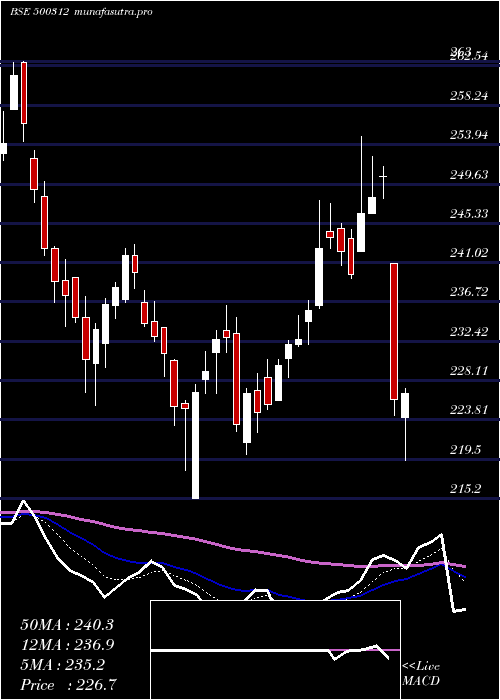
Daily price and charts and targets OngcCorpn Strong Daily Stock price targets for OngcCorpn 500312 are 247.73 and 249.73 | Daily Target 1 | 246.28 | | Daily Target 2 | 247.17 | | Daily Target 3 | 248.28333333333 | | Daily Target 4 | 249.17 | | Daily Target 5 | 250.28 |
Daily price and volume Ongc Corpn
| Date |
Closing |
Open |
Range |
Volume |
Tue 21 October 2025 |
248.05 (-0.22%) |
247.40 |
247.40 - 249.40 |
0.1246 times |
Mon 20 October 2025 |
248.60 (0.36%) |
247.30 |
245.25 - 249.20 |
1.6179 times |
Fri 17 October 2025 |
247.70 (-0.26%) |
248.25 |
244.85 - 248.75 |
1.8922 times |
Thu 16 October 2025 |
248.35 (0.2%) |
247.85 |
245.90 - 248.60 |
0.6708 times |
Wed 15 October 2025 |
247.85 (1.2%) |
244.90 |
244.25 - 248.35 |
1.0796 times |
Tue 14 October 2025 |
244.90 (0.37%) |
246.35 |
244.20 - 248.70 |
1.4694 times |
Mon 13 October 2025 |
244.00 (-0.91%) |
245.40 |
241.45 - 245.50 |
0.6832 times |
Fri 10 October 2025 |
246.25 (1.17%) |
243.80 |
243.80 - 247.00 |
1.1128 times |
Thu 09 October 2025 |
243.40 (0.62%) |
241.70 |
240.60 - 244.45 |
0.6761 times |
Wed 08 October 2025 |
241.90 (-1.41%) |
246.90 |
241.30 - 246.90 |
0.6734 times |
Tue 07 October 2025 |
245.35 (-0.24%) |
245.20 |
244.65 - 249.60 |
1.452 times |
Weekly price and charts OngcCorpn Strong weekly Stock price targets for OngcCorpn 500312 are 246.65 and 250.8 | Weekly Target 1 | 243.42 | | Weekly Target 2 | 245.73 | | Weekly Target 3 | 247.56666666667 | | Weekly Target 4 | 249.88 | | Weekly Target 5 | 251.72 |
Weekly price and volumes for Ongc Corpn
| Date |
Closing |
Open |
Range |
Volume |
Tue 21 October 2025 |
248.05 (0.14%) |
247.30 |
245.25 - 249.40 |
0.2835 times |
Fri 17 October 2025 |
247.70 (0.59%) |
245.40 |
241.45 - 248.75 |
0.943 times |
Fri 10 October 2025 |
246.25 (1.07%) |
243.55 |
240.60 - 249.60 |
0.7532 times |
Fri 03 October 2025 |
243.65 (2.33%) |
238.70 |
238.10 - 246.20 |
0.9453 times |
Fri 26 September 2025 |
238.10 (0.61%) |
237.25 |
235.20 - 242.20 |
0.9607 times |
Fri 19 September 2025 |
236.65 (1.44%) |
232.90 |
232.00 - 237.90 |
2.4567 times |
Fri 12 September 2025 |
233.30 (-0.36%) |
234.20 |
230.75 - 235.30 |
0.4195 times |
Fri 05 September 2025 |
234.15 (0.15%) |
233.70 |
233.00 - 242.40 |
0.5814 times |
Fri 29 August 2025 |
233.80 (-1.06%) |
235.30 |
231.30 - 237.35 |
2.0581 times |
Fri 22 August 2025 |
236.30 (-0.25%) |
237.20 |
235.45 - 240.90 |
0.5985 times |
Thu 14 August 2025 |
236.90 (1.63%) |
233.85 |
231.55 - 239.90 |
0.507 times |
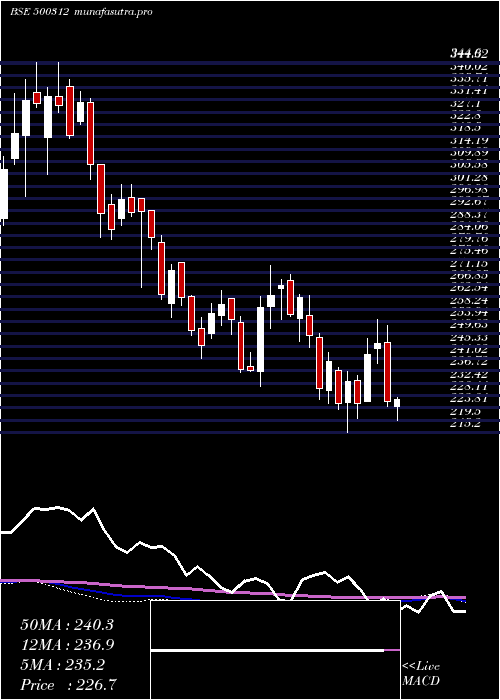
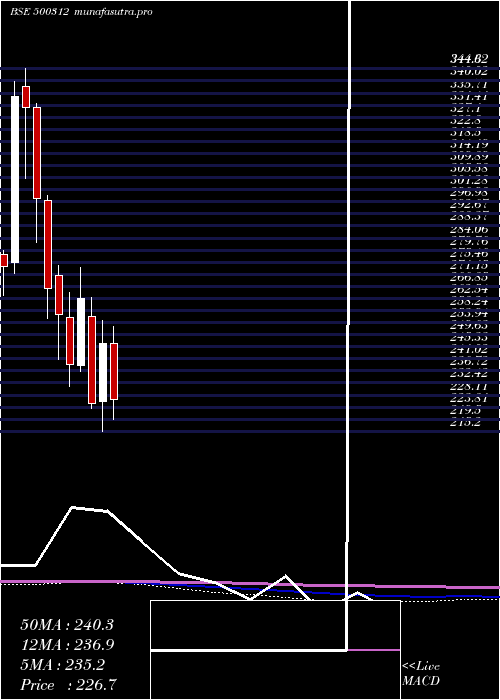
Monthly price and charts OngcCorpn Strong monthly Stock price targets for OngcCorpn 500312 are 243.1 and 254.55 | Monthly Target 1 | 233.82 | | Monthly Target 2 | 240.93 | | Monthly Target 3 | 245.26666666667 | | Monthly Target 4 | 252.38 | | Monthly Target 5 | 256.72 |
Monthly price and volumes Ongc Corpn
| Date |
Closing |
Open |
Range |
Volume |
Tue 21 October 2025 |
248.05 (3.55%) |
238.15 |
238.15 - 249.60 |
0.682 times |
Tue 30 September 2025 |
239.55 (2.46%) |
233.70 |
230.75 - 242.40 |
1.1952 times |
Fri 29 August 2025 |
233.80 (-2.99%) |
239.30 |
231.30 - 240.90 |
1.115 times |
Thu 31 July 2025 |
241.00 (-1.29%) |
245.75 |
237.85 - 247.25 |
1.3008 times |
Mon 30 June 2025 |
244.15 (1.96%) |
238.55 |
235.50 - 257.35 |
1.2549 times |
Fri 30 May 2025 |
239.45 (-1.95%) |
241.05 |
226.30 - 252.75 |
0.8718 times |
Wed 30 April 2025 |
244.20 (-0.89%) |
246.45 |
219.35 - 252.60 |
0.9912 times |
Fri 28 March 2025 |
246.40 (9.37%) |
225.65 |
215.20 - 254.80 |
0.9023 times |
Fri 28 February 2025 |
225.30 (-14.17%) |
256.20 |
223.20 - 263.00 |
0.6274 times |
Fri 31 January 2025 |
262.50 (9.81%) |
238.50 |
236.60 - 273.45 |
1.0594 times |
Tue 31 December 2024 |
239.05 (-6.89%) |
255.90 |
231.15 - 264.65 |
0.8338 times |
DMA SMA EMA moving averages of Ongc Corpn 500312
DMA (daily moving average) of Ongc Corpn 500312
| DMA period | DMA value | | 5 day DMA | 248.11 | | 12 day DMA | 246.03 | | 20 day DMA | 243.58 | | 35 day DMA | 239.91 | | 50 day DMA | 238.81 | | 100 day DMA | 240.96 | | 150 day DMA | 240.51 | | 200 day DMA | 242.31 | EMA (exponential moving average) of Ongc Corpn 500312
| EMA period | EMA current | EMA prev | EMA prev2 | | 5 day EMA | 247.66 | 247.46 | 246.89 | | 12 day EMA | 245.86 | 245.46 | 244.89 | | 20 day EMA | 244.01 | 243.59 | 243.06 | | 35 day EMA | 241.75 | 241.38 | 240.95 | | 50 day EMA | 239.41 | 239.06 | 238.67 |
SMA (simple moving average) of Ongc Corpn 500312
| SMA period | SMA current | SMA prev | SMA prev2 | | 5 day SMA | 248.11 | 247.48 | 246.56 | | 12 day SMA | 246.03 | 245.66 | 245.2 | | 20 day SMA | 243.58 | 243.06 | 242.47 | | 35 day SMA | 239.91 | 239.64 | 239.22 | | 50 day SMA | 238.81 | 238.52 | 238.23 | | 100 day SMA | 240.96 | 240.91 | 240.86 | | 150 day SMA | 240.51 | 240.38 | 240.24 | | 200 day SMA | 242.31 | 242.28 | 242.22 |
|
|
