NaharSpg 500296 full analysis,charts,indicators,moving averages,SMA,DMA,EMA,ADX,MACD,RSINahar Spg 500296 WideScreen charts, DMA,SMA,EMA technical analysis, forecast prediction, by indicators ADX,MACD,RSI,CCI BSE stock exchange
Daily price and charts and targets NaharSpg Strong Daily Stock price targets for NaharSpg 500296 are 200.6 and 212.6 | Daily Target 1 | 198.37 | | Daily Target 2 | 202.83 | | Daily Target 3 | 210.36666666667 | | Daily Target 4 | 214.83 | | Daily Target 5 | 222.37 |
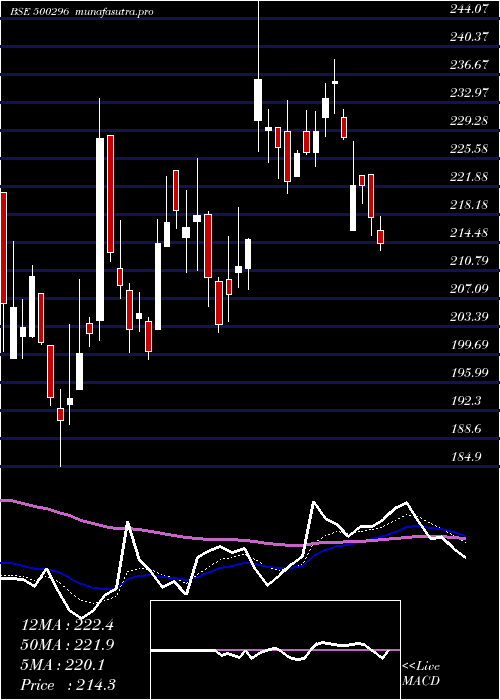
Daily price and volume Nahar Spg
| Date |
Closing |
Open |
Range |
Volume |
Thu 23 October 2025 |
207.30 (3.65%) |
211.05 |
205.90 - 217.90 |
1.6475 times |
Mon 20 October 2025 |
200.00 (0.33%) |
212.95 |
199.90 - 212.95 |
0.7104 times |
Fri 17 October 2025 |
199.35 (-0.62%) |
200.05 |
199.25 - 200.30 |
2.5385 times |
Thu 16 October 2025 |
200.60 (0.65%) |
202.75 |
199.05 - 202.75 |
0.226 times |
Wed 15 October 2025 |
199.30 (0.66%) |
199.25 |
198.80 - 200.50 |
0.5573 times |
Tue 14 October 2025 |
198.00 (-2.41%) |
203.75 |
197.90 - 203.75 |
1.4798 times |
Mon 13 October 2025 |
202.90 (-1.27%) |
204.85 |
201.55 - 205.80 |
0.5629 times |
Fri 10 October 2025 |
205.50 (1.26%) |
200.50 |
200.50 - 211.95 |
0.8861 times |
Thu 09 October 2025 |
202.95 (-0.95%) |
205.50 |
202.85 - 205.50 |
1.2061 times |
Wed 08 October 2025 |
204.90 (-0.22%) |
205.90 |
204.40 - 208.20 |
0.1855 times |
Tue 07 October 2025 |
205.35 (-0.8%) |
208.85 |
205.35 - 208.85 |
0.2762 times |
Weekly price and charts NaharSpg Strong weekly Stock price targets for NaharSpg 500296 are 194.6 and 212.6 | Weekly Target 1 | 190.37 | | Weekly Target 2 | 198.83 | | Weekly Target 3 | 208.36666666667 | | Weekly Target 4 | 216.83 | | Weekly Target 5 | 226.37 |
Weekly price and volumes for Nahar Spg
| Date |
Closing |
Open |
Range |
Volume |
Thu 23 October 2025 |
207.30 (3.99%) |
212.95 |
199.90 - 217.90 |
0.3418 times |
Fri 17 October 2025 |
199.35 (-2.99%) |
204.85 |
197.90 - 205.80 |
0.7776 times |
Fri 10 October 2025 |
205.50 (-2.26%) |
210.60 |
200.50 - 211.95 |
0.4425 times |
Fri 03 October 2025 |
210.25 (0.67%) |
210.10 |
204.75 - 212.10 |
0.427 times |
Fri 26 September 2025 |
208.85 (-3.49%) |
217.40 |
207.00 - 220.00 |
1.0841 times |
Fri 19 September 2025 |
216.40 (0.09%) |
216.20 |
214.40 - 222.00 |
1.4879 times |
Fri 12 September 2025 |
216.20 (1.36%) |
215.40 |
211.05 - 223.25 |
1.0308 times |
Fri 05 September 2025 |
213.30 (0.16%) |
214.50 |
212.45 - 225.00 |
1.1082 times |
Fri 29 August 2025 |
212.95 (-0.95%) |
217.15 |
207.15 - 220.05 |
1.2519 times |
Fri 22 August 2025 |
215.00 (7.85%) |
203.90 |
202.95 - 225.85 |
2.0481 times |
Thu 14 August 2025 |
199.35 (-2.66%) |
207.80 |
196.45 - 207.80 |
1.1373 times |

Monthly price and charts NaharSpg Strong monthly Stock price targets for NaharSpg 500296 are 202.6 and 222.6 | Monthly Target 1 | 187.7 | | Monthly Target 2 | 197.5 | | Monthly Target 3 | 207.7 | | Monthly Target 4 | 217.5 | | Monthly Target 5 | 227.7 |
Monthly price and volumes Nahar Spg
| Date |
Closing |
Open |
Range |
Volume |
Thu 23 October 2025 |
207.30 (0.95%) |
205.30 |
197.90 - 217.90 |
0.2565 times |
Tue 30 September 2025 |
205.35 (-3.57%) |
214.50 |
204.75 - 225.00 |
0.6573 times |
Fri 29 August 2025 |
212.95 (-15.48%) |
252.90 |
196.45 - 263.55 |
1.1172 times |
Thu 31 July 2025 |
251.95 (-8.76%) |
279.05 |
247.80 - 293.60 |
0.8041 times |
Mon 30 June 2025 |
276.15 (-5.61%) |
295.00 |
264.05 - 311.00 |
1.3528 times |
Fri 30 May 2025 |
292.55 (36.51%) |
218.10 |
214.30 - 308.30 |
2.0824 times |
Wed 30 April 2025 |
214.30 (3.23%) |
210.45 |
208.25 - 247.50 |
0.6167 times |
Fri 28 March 2025 |
207.60 (7.01%) |
192.50 |
184.90 - 233.50 |
1.4721 times |
Fri 28 February 2025 |
194.00 (-17.9%) |
228.30 |
192.85 - 248.00 |
0.7662 times |
Fri 31 January 2025 |
236.30 (-11.5%) |
269.40 |
209.70 - 276.35 |
0.8749 times |
Tue 31 December 2024 |
267.00 (2.77%) |
255.50 |
255.50 - 315.00 |
1.1442 times |

DMA SMA EMA moving averages of Nahar Spg 500296
DMA (daily moving average) of Nahar Spg 500296
| DMA period | DMA value | | 5 day DMA | 201.31 | | 12 day DMA | 202.76 | | 20 day DMA | 205.9 | | 35 day DMA | 210.3 | | 50 day DMA | 210.19 | | 100 day DMA | 239.63 | | 150 day DMA | 237.93 | | 200 day DMA | 236 | EMA (exponential moving average) of Nahar Spg 500296
| EMA period | EMA current | EMA prev | EMA prev2 | | 5 day EMA | 202.67 | 200.35 | 200.52 | | 12 day EMA | 203.48 | 202.79 | 203.3 | | 20 day EMA | 205.46 | 205.27 | 205.83 | | 35 day EMA | 207.95 | 207.99 | 208.46 | | 50 day EMA | 210.76 | 210.9 | 211.34 |
SMA (simple moving average) of Nahar Spg 500296
| SMA period | SMA current | SMA prev | SMA prev2 | | 5 day SMA | 201.31 | 199.45 | 200.03 | | 12 day SMA | 202.76 | 203.01 | 203.57 | | 20 day SMA | 205.9 | 206.47 | 207.29 | | 35 day SMA | 210.3 | 210.58 | 210.95 | | 50 day SMA | 210.19 | 210.38 | 210.82 | | 100 day SMA | 239.63 | 240.4 | 241.32 | | 150 day SMA | 237.93 | 237.88 | 237.84 | | 200 day SMA | 236 | 236.39 | 236.85 |
|
|
