MidIndia 500277 full analysis,charts,indicators,moving averages,SMA,DMA,EMA,ADX,MACD,RSIMid India 500277 WideScreen charts, DMA,SMA,EMA technical analysis, forecast prediction, by indicators ADX,MACD,RSI,CCI BSE stock exchange
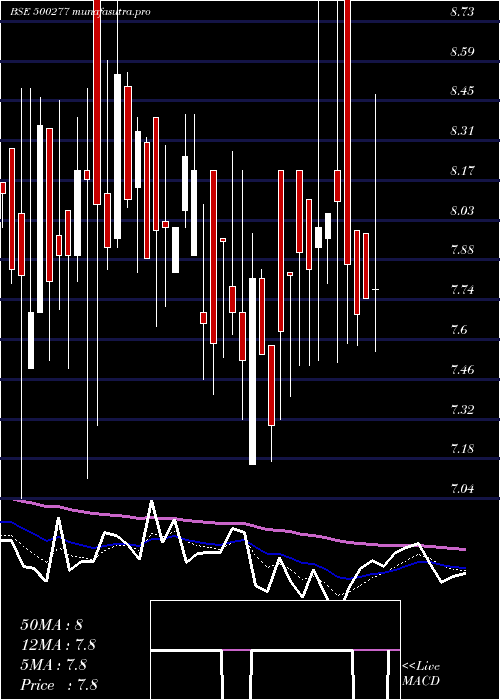
Daily price and charts and targets MidIndia Strong Daily Stock price targets for MidIndia 500277 are 7.69 and 8.86 | Daily Target 1 | 6.74 | | Daily Target 2 | 7.47 | | Daily Target 3 | 7.91 | | Daily Target 4 | 8.64 | | Daily Target 5 | 9.08 |
Daily price and volume Mid India
| Date |
Closing |
Open |
Range |
Volume |
Fri 05 December 2025 |
8.20 (5.53%) |
7.77 |
7.18 - 8.35 |
0.7095 times |
Thu 04 December 2025 |
7.77 (8.67%) |
7.15 |
6.78 - 7.85 |
1.8528 times |
Wed 03 December 2025 |
7.15 (0%) |
7.39 |
7.02 - 7.39 |
0.236 times |
Tue 02 December 2025 |
7.15 (2%) |
7.02 |
7.02 - 7.25 |
0.5537 times |
Mon 01 December 2025 |
7.01 (0.14%) |
7.00 |
7.00 - 7.39 |
0.8808 times |
Fri 28 November 2025 |
7.00 (0%) |
7.05 |
6.70 - 7.05 |
0.9471 times |
Thu 27 November 2025 |
7.00 (0%) |
7.30 |
7.00 - 7.30 |
3.0779 times |
Wed 26 November 2025 |
7.00 (-6.54%) |
7.52 |
6.92 - 7.57 |
0.9908 times |
Tue 25 November 2025 |
7.49 (5.2%) |
7.19 |
7.00 - 7.49 |
0.5078 times |
Mon 24 November 2025 |
7.12 (-1.79%) |
7.25 |
7.05 - 7.59 |
0.2437 times |
Fri 21 November 2025 |
7.25 (-1.76%) |
7.45 |
7.25 - 7.45 |
0.3603 times |
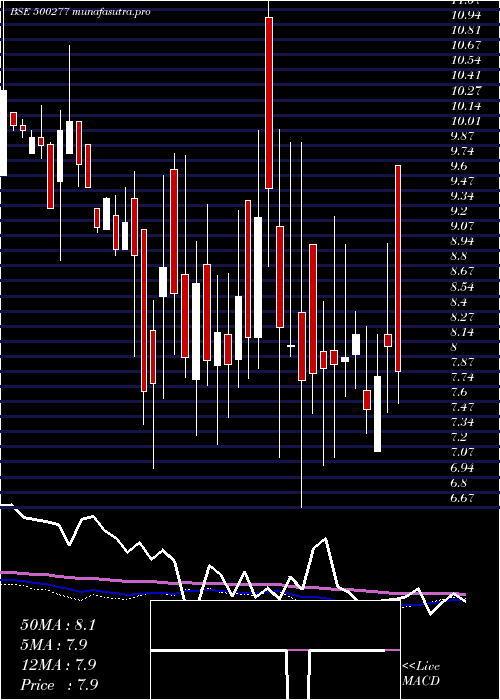
Weekly price and charts MidIndia Strong weekly Stock price targets for MidIndia 500277 are 7.49 and 9.06 | Weekly Target 1 | 6.21 | | Weekly Target 2 | 7.2 | | Weekly Target 3 | 7.7766666666667 | | Weekly Target 4 | 8.77 | | Weekly Target 5 | 9.35 |
Weekly price and volumes for Mid India
| Date |
Closing |
Open |
Range |
Volume |
Fri 05 December 2025 |
8.20 (17.14%) |
7.00 |
6.78 - 8.35 |
0.6006 times |
Fri 28 November 2025 |
7.00 (-3.45%) |
7.25 |
6.70 - 7.59 |
0.8183 times |
Fri 21 November 2025 |
7.25 (-7.99%) |
7.61 |
7.25 - 8.46 |
0.842 times |
Fri 14 November 2025 |
7.88 (0.13%) |
7.75 |
7.30 - 8.87 |
3.2131 times |
Fri 07 November 2025 |
7.87 (4.1%) |
7.59 |
7.15 - 7.92 |
0.21 times |
Fri 31 October 2025 |
7.56 (0.67%) |
8.05 |
7.26 - 8.21 |
0.9934 times |
Thu 23 October 2025 |
7.51 (3.3%) |
7.19 |
7.16 - 8.00 |
0.4905 times |
Fri 17 October 2025 |
7.27 (-9.46%) |
7.87 |
6.91 - 8.29 |
1.1705 times |
Fri 10 October 2025 |
8.03 (1.01%) |
7.90 |
7.28 - 8.35 |
0.8833 times |
Fri 03 October 2025 |
7.95 (-2.57%) |
8.16 |
7.55 - 8.38 |
0.7783 times |
Fri 26 September 2025 |
8.16 (-2.39%) |
8.40 |
7.72 - 8.40 |
0.836 times |
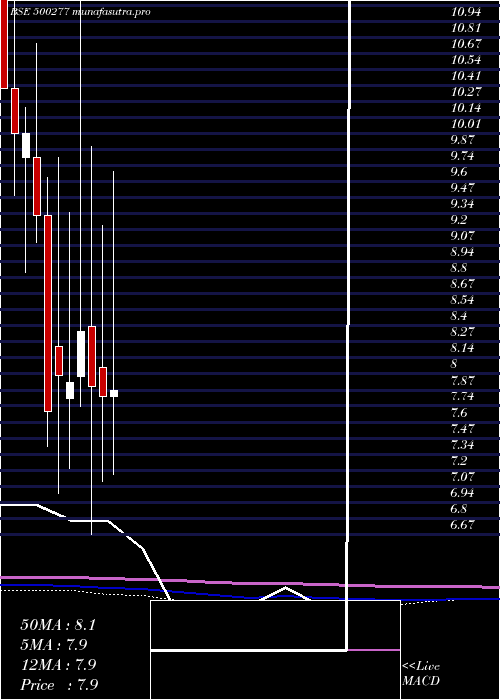
Monthly price and charts MidIndia Strong monthly Stock price targets for MidIndia 500277 are 7.49 and 9.06 | Monthly Target 1 | 6.21 | | Monthly Target 2 | 7.2 | | Monthly Target 3 | 7.7766666666667 | | Monthly Target 4 | 8.77 | | Monthly Target 5 | 9.35 |
Monthly price and volumes Mid India
| Date |
Closing |
Open |
Range |
Volume |
Fri 05 December 2025 |
8.20 (17.14%) |
7.00 |
6.78 - 8.35 |
0.1323 times |
Fri 28 November 2025 |
7.00 (-7.41%) |
7.59 |
6.70 - 8.87 |
1.1199 times |
Fri 31 October 2025 |
7.56 (-1.82%) |
7.74 |
6.91 - 8.35 |
0.9262 times |
Mon 29 September 2025 |
7.70 (1.85%) |
8.94 |
7.11 - 8.96 |
0.914 times |
Fri 29 August 2025 |
7.56 (2.16%) |
7.47 |
7.07 - 8.95 |
0.6221 times |
Thu 31 July 2025 |
7.40 (-5.37%) |
7.82 |
7.16 - 9.69 |
0.7813 times |
Mon 30 June 2025 |
7.82 (-1.01%) |
8.06 |
7.11 - 9.24 |
1.4016 times |
Fri 30 May 2025 |
7.90 (-5.5%) |
8.40 |
6.67 - 9.90 |
1.9737 times |
Wed 30 April 2025 |
8.36 (5.42%) |
7.98 |
7.73 - 12.00 |
1.0269 times |
Fri 28 March 2025 |
7.93 (-0.75%) |
7.80 |
7.22 - 9.35 |
1.1019 times |
Fri 28 February 2025 |
7.99 (3.9%) |
8.23 |
7.01 - 9.80 |
1.1118 times |
DMA SMA EMA moving averages of Mid India 500277
DMA (daily moving average) of Mid India 500277
| DMA period | DMA value | | 5 day DMA | 7.46 | | 12 day DMA | 7.29 | | 20 day DMA | 7.5 | | 35 day DMA | 7.53 | | 50 day DMA | 7.67 | | 100 day DMA | 7.77 | | 150 day DMA | 7.87 | | 200 day DMA | 8.05 | EMA (exponential moving average) of Mid India 500277
| EMA period | EMA current | EMA prev | EMA prev2 | | 5 day EMA | 7.63 | 7.34 | 7.12 | | 12 day EMA | 7.47 | 7.34 | 7.26 | | 20 day EMA | 7.49 | 7.41 | 7.37 | | 35 day EMA | 7.58 | 7.54 | 7.53 | | 50 day EMA | 7.68 | 7.66 | 7.66 |
SMA (simple moving average) of Mid India 500277
| SMA period | SMA current | SMA prev | SMA prev2 | | 5 day SMA | 7.46 | 7.22 | 7.06 | | 12 day SMA | 7.29 | 7.28 | 7.26 | | 20 day SMA | 7.5 | 7.49 | 7.48 | | 35 day SMA | 7.53 | 7.52 | 7.52 | | 50 day SMA | 7.67 | 7.66 | 7.66 | | 100 day SMA | 7.77 | 7.76 | 7.76 | | 150 day SMA | 7.87 | 7.88 | 7.89 | | 200 day SMA | 8.05 | 8.05 | 8.05 |
|
|
