MafatlalInd 500264 full analysis,charts,indicators,moving averages,SMA,DMA,EMA,ADX,MACD,RSIMafatlal Ind 500264 WideScreen charts, DMA,SMA,EMA technical analysis, forecast prediction, by indicators ADX,MACD,RSI,CCI BSE stock exchange
Daily price and charts and targets MafatlalInd Strong Daily Stock price targets for MafatlalInd 500264 are 182.78 and 207.13 | Daily Target 1 | 165.62 | | Daily Target 2 | 175.58 | | Daily Target 3 | 189.96666666667 | | Daily Target 4 | 199.93 | | Daily Target 5 | 214.32 |
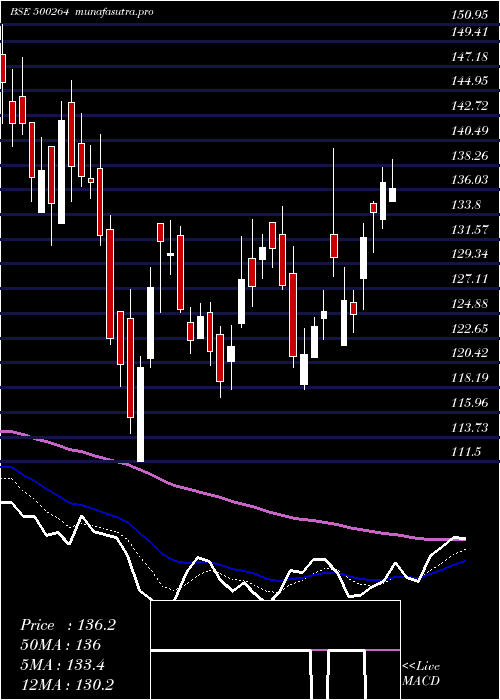
Daily price and volume Mafatlal Ind
| Date |
Closing |
Open |
Range |
Volume |
Thu 23 October 2025 |
185.55 (8.95%) |
184.00 |
180.00 - 204.35 |
6.7839 times |
Tue 21 October 2025 |
170.30 (19.97%) |
166.40 |
155.55 - 170.30 |
2.3243 times |
Mon 20 October 2025 |
141.95 (1.94%) |
139.25 |
139.25 - 143.80 |
0.1778 times |
Fri 17 October 2025 |
139.25 (-0.75%) |
139.25 |
138.05 - 142.70 |
0.0878 times |
Thu 16 October 2025 |
140.30 (0.47%) |
140.00 |
139.00 - 141.90 |
0.0986 times |
Wed 15 October 2025 |
139.65 (-0.36%) |
139.50 |
137.25 - 141.05 |
0.1098 times |
Tue 14 October 2025 |
140.15 (-0.99%) |
141.55 |
139.00 - 144.40 |
0.1627 times |
Mon 13 October 2025 |
141.55 (-0.67%) |
140.20 |
140.20 - 143.60 |
0.067 times |
Fri 10 October 2025 |
142.50 (-0.28%) |
142.90 |
140.00 - 144.05 |
0.0992 times |
Thu 09 October 2025 |
142.90 (-0.73%) |
144.00 |
141.95 - 144.70 |
0.0891 times |
Wed 08 October 2025 |
143.95 (0.28%) |
144.95 |
142.95 - 145.60 |
0.1358 times |
Weekly price and charts MafatlalInd Strong weekly Stock price targets for MafatlalInd 500264 are 162.4 and 227.5 | Weekly Target 1 | 111.28 | | Weekly Target 2 | 148.42 | | Weekly Target 3 | 176.38333333333 | | Weekly Target 4 | 213.52 | | Weekly Target 5 | 241.48 |
Weekly price and volumes for Mafatlal Ind
| Date |
Closing |
Open |
Range |
Volume |
Thu 23 October 2025 |
185.55 (33.25%) |
139.25 |
139.25 - 204.35 |
6.0089 times |
Fri 17 October 2025 |
139.25 (-2.28%) |
140.20 |
137.25 - 144.40 |
0.3402 times |
Fri 10 October 2025 |
142.50 (1.06%) |
143.00 |
140.00 - 145.60 |
0.394 times |
Fri 03 October 2025 |
141.00 (1.4%) |
139.30 |
133.75 - 142.45 |
0.2273 times |
Fri 26 September 2025 |
139.05 (-2.15%) |
142.00 |
138.00 - 145.00 |
0.3926 times |
Fri 19 September 2025 |
142.10 (-0.32%) |
143.15 |
140.15 - 145.40 |
0.3392 times |
Fri 12 September 2025 |
142.55 (-0.97%) |
144.50 |
140.80 - 148.00 |
0.4896 times |
Fri 05 September 2025 |
143.95 (1.34%) |
144.80 |
140.20 - 149.90 |
0.4217 times |
Fri 29 August 2025 |
142.05 (-7.07%) |
154.95 |
137.60 - 155.30 |
0.6007 times |
Fri 22 August 2025 |
152.85 (3.91%) |
150.70 |
143.05 - 154.80 |
0.786 times |
Thu 14 August 2025 |
147.10 (3.96%) |
144.00 |
143.40 - 152.65 |
0.9568 times |

Monthly price and charts MafatlalInd Strong monthly Stock price targets for MafatlalInd 500264 are 159.65 and 230.25 | Monthly Target 1 | 103.95 | | Monthly Target 2 | 144.75 | | Monthly Target 3 | 174.55 | | Monthly Target 4 | 215.35 | | Monthly Target 5 | 245.15 |
Monthly price and volumes Mafatlal Ind
| Date |
Closing |
Open |
Range |
Volume |
Thu 23 October 2025 |
185.55 (36.94%) |
135.00 |
133.75 - 204.35 |
2.2462 times |
Tue 30 September 2025 |
135.50 (-4.61%) |
144.80 |
135.00 - 149.90 |
0.578 times |
Fri 29 August 2025 |
142.05 (10.67%) |
127.15 |
125.00 - 162.90 |
2.0964 times |
Thu 31 July 2025 |
128.35 (0.12%) |
129.25 |
123.55 - 135.90 |
0.6943 times |
Mon 30 June 2025 |
128.20 (0.59%) |
128.80 |
123.00 - 131.00 |
0.4729 times |
Fri 30 May 2025 |
127.45 (1.63%) |
125.50 |
121.50 - 139.00 |
0.8783 times |
Wed 30 April 2025 |
125.40 (3.51%) |
120.90 |
120.90 - 141.15 |
0.5186 times |
Fri 28 March 2025 |
121.15 (0.71%) |
124.40 |
111.50 - 134.50 |
1.0082 times |
Fri 28 February 2025 |
120.30 (-21.5%) |
151.20 |
118.30 - 166.10 |
0.7184 times |
Fri 31 January 2025 |
153.25 (-19.83%) |
193.00 |
146.50 - 196.00 |
0.7887 times |
Tue 31 December 2024 |
191.15 (18.84%) |
164.80 |
158.05 - 210.00 |
1.9759 times |

DMA SMA EMA moving averages of Mafatlal Ind 500264
DMA (daily moving average) of Mafatlal Ind 500264
| DMA period | DMA value | | 5 day DMA | 155.47 | | 12 day DMA | 147.63 | | 20 day DMA | 144.29 | | 35 day DMA | 143.93 | | 50 day DMA | 144.79 | | 100 day DMA | 136.75 | | 150 day DMA | 134 | | 200 day DMA | 139.49 | EMA (exponential moving average) of Mafatlal Ind 500264
| EMA period | EMA current | EMA prev | EMA prev2 | | 5 day EMA | 162.26 | 150.62 | 140.78 | | 12 day EMA | 151.62 | 145.45 | 140.93 | | 20 day EMA | 147.96 | 144.01 | 141.24 | | 35 day EMA | 146.07 | 143.75 | 142.19 | | 50 day EMA | 145.89 | 144.27 | 143.21 |
SMA (simple moving average) of Mafatlal Ind 500264
| SMA period | SMA current | SMA prev | SMA prev2 | | 5 day SMA | 155.47 | 146.29 | 140.26 | | 12 day SMA | 147.63 | 144 | 141.56 | | 20 day SMA | 144.29 | 142.07 | 140.61 | | 35 day SMA | 143.93 | 142.76 | 142.03 | | 50 day SMA | 144.79 | 143.91 | 143.24 | | 100 day SMA | 136.75 | 136.19 | 135.79 | | 150 day SMA | 134 | 133.64 | 133.35 | | 200 day SMA | 139.49 | 139.53 | 139.64 |
|
|
