Ingersoll 500210 full analysis,charts,indicators,moving averages,SMA,DMA,EMA,ADX,MACD,RSIIngersoll 500210 WideScreen charts, DMA,SMA,EMA technical analysis, forecast prediction, by indicators ADX,MACD,RSI,CCI BSE stock exchange
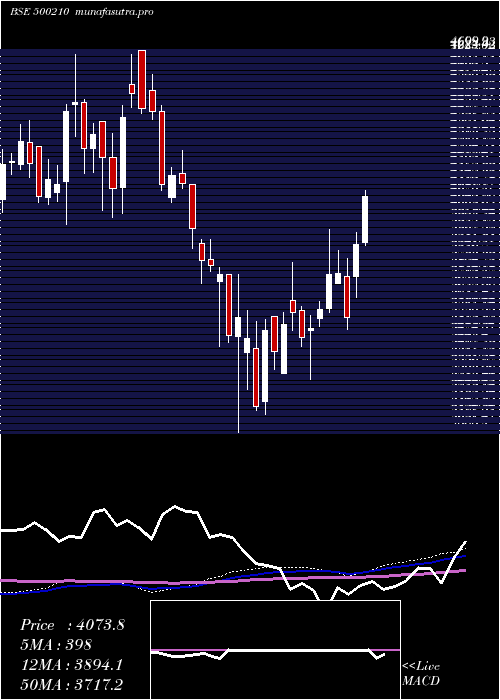
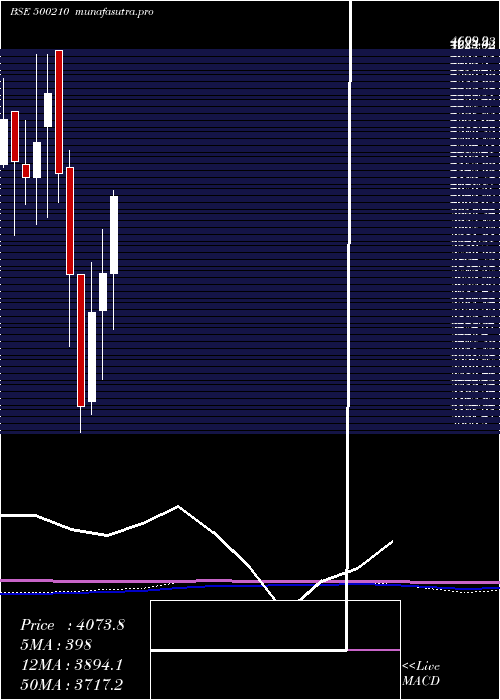
Daily price and charts and targets Ingersoll Strong Daily Stock price targets for Ingersoll 500210 are 3937.55 and 4110.25 | Daily Target 1 | 3800.53 | | Daily Target 2 | 3901.87 | | Daily Target 3 | 3973.2333333333 | | Daily Target 4 | 4074.57 | | Daily Target 5 | 4145.93 |
Daily price and volume Ingersoll
| Date |
Closing |
Open |
Range |
Volume |
Thu 23 October 2025 |
4003.20 (2.09%) |
3929.85 |
3871.90 - 4044.60 |
1.4872 times |
Tue 21 October 2025 |
3921.30 (0.45%) |
3752.35 |
3752.35 - 3999.95 |
1.2601 times |
Mon 20 October 2025 |
3903.80 (4.52%) |
3727.70 |
3655.00 - 3946.00 |
3.2318 times |
Fri 17 October 2025 |
3735.05 (-1.05%) |
3763.70 |
3720.10 - 3769.20 |
0.36 times |
Thu 16 October 2025 |
3774.55 (-0.34%) |
3799.75 |
3759.70 - 3803.30 |
0.4307 times |
Wed 15 October 2025 |
3787.50 (-1.73%) |
3841.05 |
3750.00 - 3883.10 |
1.0986 times |
Tue 14 October 2025 |
3854.25 (-1.57%) |
3925.00 |
3838.00 - 3925.00 |
0.9623 times |
Mon 13 October 2025 |
3915.80 (-1.77%) |
3981.70 |
3911.00 - 3981.70 |
0.2153 times |
Fri 10 October 2025 |
3986.20 (-0.31%) |
3974.00 |
3955.50 - 4012.00 |
0.3769 times |
Thu 09 October 2025 |
3998.70 (-0.06%) |
4001.00 |
3960.00 - 4025.90 |
0.5771 times |
Wed 08 October 2025 |
4001.00 (-2.51%) |
4074.00 |
3977.15 - 4083.50 |
1.9297 times |
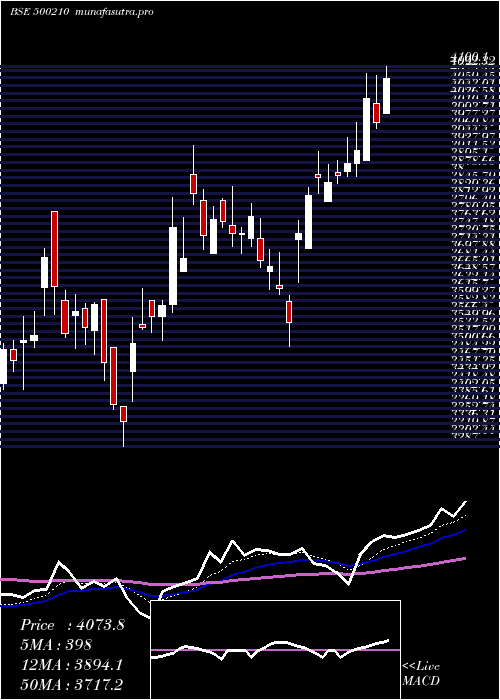
Weekly price and charts Ingersoll Strong weekly Stock price targets for Ingersoll 500210 are 3829.1 and 4218.7 | Weekly Target 1 | 3511.33 | | Weekly Target 2 | 3757.27 | | Weekly Target 3 | 3900.9333333333 | | Weekly Target 4 | 4146.87 | | Weekly Target 5 | 4290.53 |
Weekly price and volumes for Ingersoll
| Date |
Closing |
Open |
Range |
Volume |
Thu 23 October 2025 |
4003.20 (7.18%) |
3727.70 |
3655.00 - 4044.60 |
0.3477 times |
Fri 17 October 2025 |
3735.05 (-6.3%) |
3981.70 |
3720.10 - 3981.70 |
0.1784 times |
Fri 10 October 2025 |
3986.20 (-3.93%) |
4159.95 |
3955.50 - 4159.95 |
0.2613 times |
Fri 03 October 2025 |
4149.25 (3.57%) |
4006.00 |
3874.00 - 4449.95 |
0.5155 times |
Fri 26 September 2025 |
4006.40 (0.87%) |
3978.00 |
3905.15 - 4026.00 |
7.459 times |
Fri 19 September 2025 |
3971.65 (2.87%) |
3854.10 |
3833.55 - 3975.80 |
0.2573 times |
Fri 12 September 2025 |
3860.75 (1.6%) |
3805.00 |
3790.40 - 3929.95 |
0.1541 times |
Fri 05 September 2025 |
3799.95 (0.18%) |
3796.10 |
3774.35 - 3899.95 |
0.1957 times |
Fri 29 August 2025 |
3793.15 (0.33%) |
3788.00 |
3675.00 - 3890.00 |
0.305 times |
Fri 22 August 2025 |
3780.60 (7.16%) |
3550.00 |
3528.00 - 3803.05 |
0.326 times |
Thu 14 August 2025 |
3528.05 (-2.24%) |
3555.35 |
3516.00 - 3680.00 |
0.2129 times |
Monthly price and charts Ingersoll Strong monthly Stock price targets for Ingersoll 500210 are 3829.1 and 4624.05 | Monthly Target 1 | 3241.1 | | Monthly Target 2 | 3622.15 | | Monthly Target 3 | 4036.05 | | Monthly Target 4 | 4417.1 | | Monthly Target 5 | 4831 |
Monthly price and volumes Ingersoll
| Date |
Closing |
Open |
Range |
Volume |
Thu 23 October 2025 |
4003.20 (1.84%) |
3935.90 |
3655.00 - 4449.95 |
0.3977 times |
Tue 30 September 2025 |
3930.80 (3.63%) |
3796.10 |
3774.35 - 4026.00 |
2.7437 times |
Fri 29 August 2025 |
3793.15 (-1.88%) |
3875.90 |
3516.00 - 3899.90 |
0.4137 times |
Thu 31 July 2025 |
3865.90 (-0.31%) |
3900.85 |
3809.00 - 4279.90 |
0.6388 times |
Mon 30 June 2025 |
3877.80 (-1.1%) |
3885.35 |
3709.00 - 3975.00 |
0.5817 times |
Fri 30 May 2025 |
3921.10 (4.78%) |
3742.00 |
3501.00 - 4174.90 |
0.6478 times |
Wed 30 April 2025 |
3742.20 (4.64%) |
3582.50 |
3287.00 - 3931.35 |
0.5714 times |
Fri 28 March 2025 |
3576.20 (12.78%) |
3194.30 |
3136.10 - 3789.95 |
0.744 times |
Fri 28 February 2025 |
3171.00 (-15.16%) |
3740.00 |
3060.80 - 3740.00 |
0.8243 times |
Fri 31 January 2025 |
3737.60 (-10.46%) |
4198.85 |
3429.10 - 4273.40 |
2.4369 times |
Tue 31 December 2024 |
4174.00 (-7.6%) |
4699.90 |
4048.95 - 4699.90 |
13.8774 times |
DMA SMA EMA moving averages of Ingersoll 500210
DMA (daily moving average) of Ingersoll 500210
| DMA period | DMA value | | 5 day DMA | 3867.58 | | 12 day DMA | 3915.46 | | 20 day DMA | 3957.47 | | 35 day DMA | 3930.78 | | 50 day DMA | 3864.47 | | 100 day DMA | 3887.23 | | 150 day DMA | 3817.93 | | 200 day DMA | 3779.97 | EMA (exponential moving average) of Ingersoll 500210
| EMA period | EMA current | EMA prev | EMA prev2 | | 5 day EMA | 3913.75 | 3869.03 | 3842.9 | | 12 day EMA | 3913.69 | 3897.42 | 3893.08 | | 20 day EMA | 3919.51 | 3910.7 | 3909.59 | | 35 day EMA | 3891.08 | 3884.48 | 3882.31 | | 50 day EMA | 3852.14 | 3845.98 | 3842.91 |
SMA (simple moving average) of Ingersoll 500210
| SMA period | SMA current | SMA prev | SMA prev2 | | 5 day SMA | 3867.58 | 3824.44 | 3811.03 | | 12 day SMA | 3915.46 | 3920.7 | 3939.69 | | 20 day SMA | 3957.47 | 3957.14 | 3959.38 | | 35 day SMA | 3930.78 | 3925.17 | 3921.58 | | 50 day SMA | 3864.47 | 3856.58 | 3850.9 | | 100 day SMA | 3887.23 | 3887.44 | 3888.71 | | 150 day SMA | 3817.93 | 3814.33 | 3810.97 | | 200 day SMA | 3779.97 | 3780.65 | 3781.67 |
|
|
