IndGlycols 500201 full analysis,charts,indicators,moving averages,SMA,DMA,EMA,ADX,MACD,RSIInd Glycols 500201 WideScreen charts, DMA,SMA,EMA technical analysis, forecast prediction, by indicators ADX,MACD,RSI,CCI BSE stock exchange
Daily price and charts and targets IndGlycols Strong Daily Stock price targets for IndGlycols 500201 are 822.53 and 853.78 | Daily Target 1 | 800.05 | | Daily Target 2 | 813.75 | | Daily Target 3 | 831.3 | | Daily Target 4 | 845 | | Daily Target 5 | 862.55 |
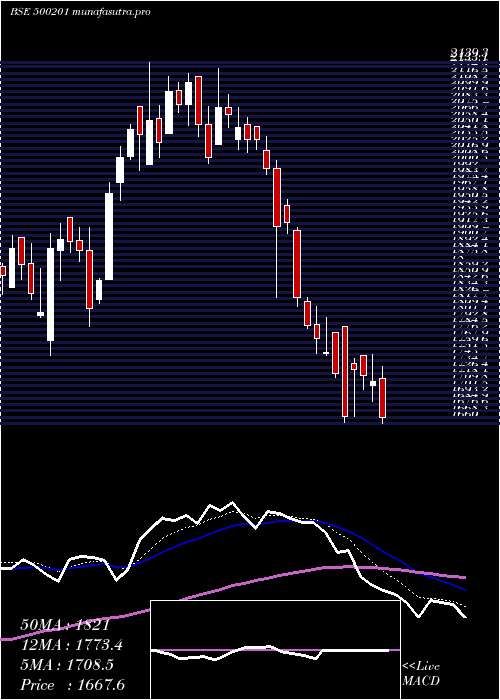
Daily price and volume Ind Glycols
| Date |
Closing |
Open |
Range |
Volume |
Tue 02 September 2025 |
827.45 (1.81%) |
820.05 |
817.60 - 848.85 |
0.8167 times |
Mon 01 September 2025 |
812.70 (0.07%) |
811.85 |
807.65 - 820.55 |
0.5337 times |
Fri 29 August 2025 |
812.10 (-0.39%) |
808.85 |
805.65 - 829.60 |
1.0192 times |
Thu 28 August 2025 |
815.25 (-0.16%) |
802.05 |
802.05 - 831.55 |
1.4927 times |
Tue 26 August 2025 |
816.55 (-0.93%) |
811.85 |
811.00 - 842.00 |
1.4648 times |
Mon 25 August 2025 |
824.20 (-3.5%) |
846.65 |
817.05 - 853.10 |
1.299 times |
Fri 22 August 2025 |
854.05 (-0.44%) |
851.55 |
850.10 - 868.00 |
0.5517 times |
Thu 21 August 2025 |
857.85 (-0.64%) |
871.25 |
854.95 - 887.00 |
0.6301 times |
Wed 20 August 2025 |
863.35 (0.31%) |
867.60 |
855.00 - 875.00 |
1.4535 times |
Tue 19 August 2025 |
860.65 (-3.59%) |
899.95 |
855.00 - 899.95 |
0.7386 times |
Mon 18 August 2025 |
892.70 (10.76%) |
822.00 |
807.00 - 908.70 |
3.0819 times |
Weekly price and charts IndGlycols Strong weekly Stock price targets for IndGlycols 500201 are 817.55 and 858.75 | Weekly Target 1 | 786.78 | | Weekly Target 2 | 807.12 | | Weekly Target 3 | 827.98333333333 | | Weekly Target 4 | 848.32 | | Weekly Target 5 | 869.18 |
Weekly price and volumes for Ind Glycols
| Date |
Closing |
Open |
Range |
Volume |
Tue 02 September 2025 |
827.45 (1.89%) |
811.85 |
807.65 - 848.85 |
0.4326 times |
Fri 29 August 2025 |
812.10 (-4.91%) |
846.65 |
802.05 - 853.10 |
1.6901 times |
Fri 22 August 2025 |
854.05 (5.96%) |
822.00 |
807.00 - 908.70 |
2.0681 times |
Thu 14 August 2025 |
806.00 (-53.68%) |
1757.45 |
796.35 - 1826.85 |
0.9699 times |
Fri 08 August 2025 |
1740.05 (4.34%) |
1675.75 |
1666.75 - 1836.65 |
0.8951 times |
Fri 01 August 2025 |
1667.60 (-3.43%) |
1787.95 |
1660.00 - 1787.95 |
0.4817 times |
Fri 25 July 2025 |
1726.75 (-10.38%) |
1915.25 |
1721.30 - 1919.65 |
0.7299 times |
Fri 18 July 2025 |
1926.85 (-6.1%) |
2056.60 |
1827.45 - 2065.55 |
0.9208 times |
Fri 11 July 2025 |
2052.10 (-2.85%) |
2119.95 |
2004.05 - 2131.25 |
0.9411 times |
Fri 04 July 2025 |
2112.35 (3.39%) |
2003.15 |
2003.15 - 2139.30 |
0.8708 times |
Fri 27 June 2025 |
2043.10 (12.74%) |
1825.00 |
1818.90 - 2079.95 |
1.3909 times |

Monthly price and charts IndGlycols Strong monthly Stock price targets for IndGlycols 500201 are 817.55 and 858.75 | Monthly Target 1 | 786.78 | | Monthly Target 2 | 807.12 | | Monthly Target 3 | 827.98333333333 | | Monthly Target 4 | 848.32 | | Monthly Target 5 | 869.18 |
Monthly price and volumes Ind Glycols
| Date |
Closing |
Open |
Range |
Volume |
Tue 02 September 2025 |
827.45 (1.89%) |
811.85 |
807.65 - 848.85 |
0.1023 times |
Fri 29 August 2025 |
812.10 (-52.67%) |
1720.00 |
796.35 - 1836.65 |
1.3628 times |
Thu 31 July 2025 |
1715.70 (-16.77%) |
2064.00 |
1661.00 - 2131.25 |
0.861 times |
Mon 30 June 2025 |
2061.45 (9.01%) |
1881.10 |
1750.00 - 2139.30 |
0.865 times |
Fri 30 May 2025 |
1891.15 (36.5%) |
1395.00 |
1349.65 - 1945.00 |
1.7216 times |
Wed 30 April 2025 |
1385.50 (24.81%) |
1090.20 |
1090.20 - 1465.00 |
0.6106 times |
Fri 28 March 2025 |
1110.05 (5.57%) |
1048.00 |
1007.80 - 1167.50 |
0.6827 times |
Fri 28 February 2025 |
1051.45 (-17.67%) |
1300.45 |
1043.00 - 1474.85 |
1.1573 times |
Fri 31 January 2025 |
1277.10 (-0.21%) |
1270.00 |
1141.35 - 1439.20 |
1.4582 times |
Tue 31 December 2024 |
1279.80 (0.27%) |
1276.30 |
1243.00 - 1513.80 |
1.1785 times |
Fri 29 November 2024 |
1276.30 (6.46%) |
1228.85 |
1091.65 - 1337.60 |
0.9691 times |

DMA SMA EMA moving averages of Ind Glycols 500201
DMA (daily moving average) of Ind Glycols 500201
| DMA period | DMA value | | 5 day DMA | 816.81 | | 12 day DMA | 836.9 | | 20 day DMA | 1120.15 | | 35 day DMA | 1420.02 | | 50 day DMA | 1605.62 | | 100 day DMA | 1617.67 | | 150 day DMA | 1473.95 | | 200 day DMA | 1426.72 | EMA (exponential moving average) of Ind Glycols 500201
| EMA period | EMA current | EMA prev | EMA prev2 | | 5 day EMA | 825.6 | 824.67 | 830.66 | | 12 day EMA | 921.01 | 938.01 | 960.78 | | 20 day EMA | 1072.14 | 1097.89 | 1127.9 | | 35 day EMA | 1304.48 | 1332.56 | 1363.17 | | 50 day EMA | 1549.7 | 1579.17 | 1610.44 |
SMA (simple moving average) of Ind Glycols 500201
| SMA period | SMA current | SMA prev | SMA prev2 | | 5 day SMA | 816.81 | 816.16 | 824.43 | | 12 day SMA | 836.9 | 838.38 | 842.05 | | 20 day SMA | 1120.15 | 1162.16 | 1207.31 | | 35 day SMA | 1420.02 | 1455.01 | 1490.93 | | 50 day SMA | 1605.62 | 1625.31 | 1646.84 | | 100 day SMA | 1617.67 | 1620.95 | 1623.93 | | 150 day SMA | 1473.95 | 1476.89 | 1480.08 | | 200 day SMA | 1426.72 | 1428.73 | 1430.66 |
|
|
