Gtl 500160 full analysis,charts,indicators,moving averages,SMA,DMA,EMA,ADX,MACD,RSIGtl 500160 WideScreen charts, DMA,SMA,EMA technical analysis, forecast prediction, by indicators ADX,MACD,RSI,CCI BSE stock exchange
Daily price and charts and targets Gtl Strong Daily Stock price targets for Gtl 500160 are 9.1 and 9.3 | Daily Target 1 | 9.05 | | Daily Target 2 | 9.14 | | Daily Target 3 | 9.2533333333333 | | Daily Target 4 | 9.34 | | Daily Target 5 | 9.45 |
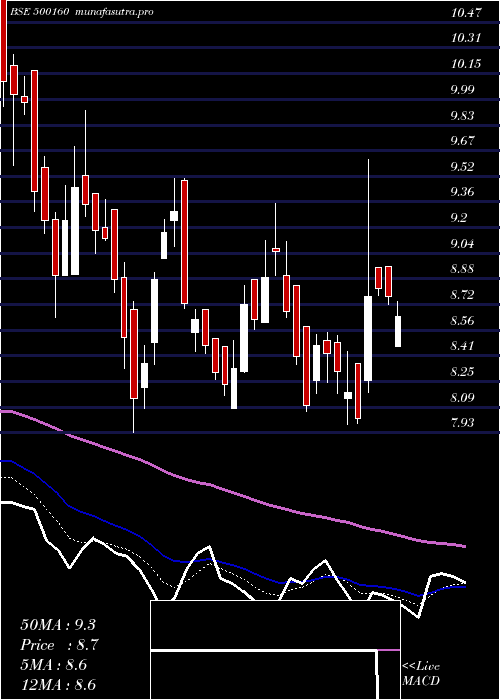
Daily price and volume Gtl
| Date |
Closing |
Open |
Range |
Volume |
Tue 21 October 2025 |
9.22 (0.22%) |
9.31 |
9.17 - 9.37 |
0.3391 times |
Mon 20 October 2025 |
9.20 (0.66%) |
9.21 |
9.14 - 9.28 |
0.9713 times |
Fri 17 October 2025 |
9.14 (-0.65%) |
9.26 |
9.09 - 9.38 |
0.8434 times |
Thu 16 October 2025 |
9.20 (0.44%) |
9.21 |
9.16 - 9.31 |
0.8414 times |
Wed 15 October 2025 |
9.16 (-0.11%) |
9.21 |
9.11 - 9.30 |
0.6119 times |
Tue 14 October 2025 |
9.17 (-1.29%) |
9.15 |
9.07 - 9.41 |
2.2603 times |
Mon 13 October 2025 |
9.29 (-0.75%) |
9.25 |
9.25 - 9.50 |
0.4689 times |
Fri 10 October 2025 |
9.36 (0.11%) |
9.47 |
9.31 - 9.50 |
2.1821 times |
Thu 09 October 2025 |
9.35 (-0.53%) |
9.46 |
9.29 - 9.47 |
0.9893 times |
Wed 08 October 2025 |
9.40 (0%) |
9.40 |
9.37 - 9.55 |
0.4922 times |
Tue 07 October 2025 |
9.40 (-0.42%) |
9.50 |
9.37 - 9.54 |
0.9828 times |
Weekly price and charts Gtl Strong weekly Stock price targets for Gtl 500160 are 9.18 and 9.41 | Weekly Target 1 | 9.01 | | Weekly Target 2 | 9.12 | | Weekly Target 3 | 9.2433333333333 | | Weekly Target 4 | 9.35 | | Weekly Target 5 | 9.47 |
Weekly price and volumes for Gtl
| Date |
Closing |
Open |
Range |
Volume |
Tue 21 October 2025 |
9.22 (0.88%) |
9.21 |
9.14 - 9.37 |
0.0588 times |
Fri 17 October 2025 |
9.14 (-2.35%) |
9.25 |
9.07 - 9.50 |
0.2255 times |
Fri 10 October 2025 |
9.36 (-2.3%) |
9.74 |
9.29 - 9.74 |
0.2313 times |
Fri 03 October 2025 |
9.58 (3.79%) |
9.28 |
9.24 - 9.95 |
0.1544 times |
Fri 26 September 2025 |
9.23 (-11.67%) |
10.49 |
9.20 - 10.49 |
0.9011 times |
Fri 19 September 2025 |
10.45 (13.71%) |
9.21 |
8.66 - 11.28 |
6.3604 times |
Fri 12 September 2025 |
9.19 (-1.18%) |
9.30 |
9.07 - 9.48 |
0.3491 times |
Fri 05 September 2025 |
9.30 (1.53%) |
9.21 |
8.31 - 9.69 |
0.4186 times |
Fri 29 August 2025 |
9.16 (-8.95%) |
10.18 |
9.11 - 10.18 |
0.5579 times |
Fri 22 August 2025 |
10.06 (10.31%) |
9.10 |
9.00 - 10.88 |
0.7428 times |
Thu 14 August 2025 |
9.12 (0.33%) |
9.02 |
8.80 - 9.27 |
0.1722 times |

Monthly price and charts Gtl Strong monthly Stock price targets for Gtl 500160 are 8.81 and 9.48 | Monthly Target 1 | 8.67 | | Monthly Target 2 | 8.95 | | Monthly Target 3 | 9.3433333333333 | | Monthly Target 4 | 9.62 | | Monthly Target 5 | 10.01 |
Monthly price and volumes Gtl
| Date |
Closing |
Open |
Range |
Volume |
Tue 21 October 2025 |
9.22 (-2.02%) |
9.50 |
9.07 - 9.74 |
0.1495 times |
Tue 30 September 2025 |
9.41 (2.73%) |
9.21 |
8.31 - 11.28 |
2.2217 times |
Fri 29 August 2025 |
9.16 (-2.14%) |
9.20 |
8.57 - 10.88 |
0.5127 times |
Thu 31 July 2025 |
9.36 (-14.44%) |
11.06 |
9.20 - 11.06 |
0.62 times |
Mon 30 June 2025 |
10.94 (25.46%) |
8.55 |
8.55 - 12.90 |
3.2146 times |
Fri 30 May 2025 |
8.72 (10.1%) |
7.82 |
7.61 - 9.19 |
0.6419 times |
Wed 30 April 2025 |
7.92 (-2.22%) |
8.25 |
7.89 - 9.62 |
0.7934 times |
Fri 28 March 2025 |
8.10 (-4.93%) |
8.69 |
7.93 - 9.50 |
0.5346 times |
Fri 28 February 2025 |
8.52 (-23.66%) |
11.27 |
8.33 - 11.31 |
0.4758 times |
Fri 31 January 2025 |
11.16 (-9.93%) |
12.47 |
10.25 - 13.14 |
0.8358 times |
Tue 31 December 2024 |
12.39 (-3.65%) |
12.85 |
11.89 - 14.89 |
2.3057 times |

DMA SMA EMA moving averages of Gtl 500160
DMA (daily moving average) of Gtl 500160
| DMA period | DMA value | | 5 day DMA | 9.18 | | 12 day DMA | 9.28 | | 20 day DMA | 9.33 | | 35 day DMA | 9.39 | | 50 day DMA | 9.38 | | 100 day DMA | 9.7 | | 150 day DMA | 9.29 | | 200 day DMA | 9.66 | EMA (exponential moving average) of Gtl 500160
| EMA period | EMA current | EMA prev | EMA prev2 | | 5 day EMA | 9.21 | 9.2 | 9.2 | | 12 day EMA | 9.27 | 9.28 | 9.3 | | 20 day EMA | 9.33 | 9.34 | 9.35 | | 35 day EMA | 9.34 | 9.35 | 9.36 | | 50 day EMA | 9.34 | 9.35 | 9.36 |
SMA (simple moving average) of Gtl 500160
| SMA period | SMA current | SMA prev | SMA prev2 | | 5 day SMA | 9.18 | 9.17 | 9.19 | | 12 day SMA | 9.28 | 9.31 | 9.33 | | 20 day SMA | 9.33 | 9.36 | 9.42 | | 35 day SMA | 9.39 | 9.39 | 9.39 | | 50 day SMA | 9.38 | 9.38 | 9.38 | | 100 day SMA | 9.7 | 9.7 | 9.69 | | 150 day SMA | 9.29 | 9.29 | 9.29 | | 200 day SMA | 9.66 | 9.68 | 9.7 |
|
|
