Uflex 500148 full analysis,charts,indicators,moving averages,SMA,DMA,EMA,ADX,MACD,RSIUflex 500148 WideScreen charts, DMA,SMA,EMA technical analysis, forecast prediction, by indicators ADX,MACD,RSI,CCI BSE stock exchange
Daily price and charts and targets Uflex Strong Daily Stock price targets for Uflex 500148 are 540.15 and 553.85 | Daily Target 1 | 537.87 | | Daily Target 2 | 542.43 | | Daily Target 3 | 551.56666666667 | | Daily Target 4 | 556.13 | | Daily Target 5 | 565.27 |
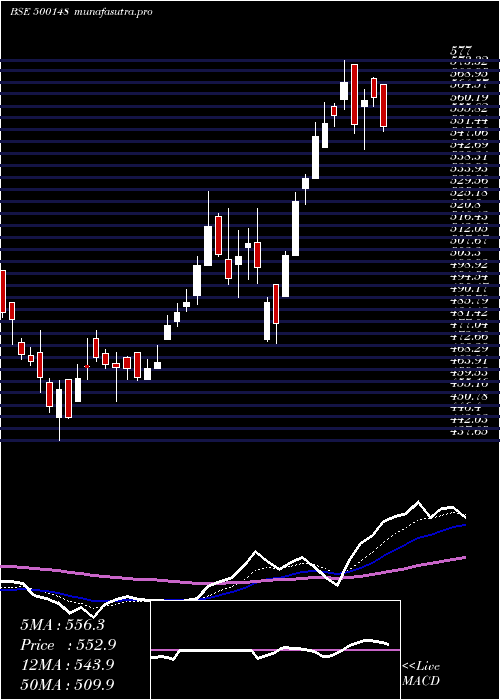
Daily price and volume Uflex
| Date |
Closing |
Open |
Range |
Volume |
Thu 23 October 2025 |
547.00 (-1.21%) |
560.70 |
547.00 - 560.70 |
1.1952 times |
Tue 21 October 2025 |
553.70 (0.5%) |
558.10 |
551.00 - 558.10 |
0.3258 times |
Mon 20 October 2025 |
550.95 (0.91%) |
545.05 |
545.05 - 553.80 |
1.0652 times |
Fri 17 October 2025 |
546.00 (0.06%) |
546.20 |
545.85 - 551.15 |
0.4605 times |
Thu 16 October 2025 |
545.65 (0.13%) |
552.85 |
545.65 - 552.85 |
0.2177 times |
Wed 15 October 2025 |
544.95 (0.17%) |
546.20 |
542.60 - 546.20 |
0.3759 times |
Tue 14 October 2025 |
544.05 (-1%) |
549.55 |
543.00 - 550.65 |
1.131 times |
Mon 13 October 2025 |
549.55 (-1.37%) |
557.20 |
547.65 - 557.20 |
0.8161 times |
Fri 10 October 2025 |
557.20 (0.78%) |
550.00 |
542.95 - 566.95 |
3.4931 times |
Thu 09 October 2025 |
552.90 (0.24%) |
555.85 |
549.55 - 557.95 |
0.9195 times |
Wed 08 October 2025 |
551.55 (-2.48%) |
565.55 |
550.60 - 567.55 |
2.9073 times |
Weekly price and charts Uflex Strong weekly Stock price targets for Uflex 500148 are 546.03 and 561.68 | Weekly Target 1 | 535.27 | | Weekly Target 2 | 541.13 | | Weekly Target 3 | 550.91666666667 | | Weekly Target 4 | 556.78 | | Weekly Target 5 | 566.57 |
Weekly price and volumes for Uflex
| Date |
Closing |
Open |
Range |
Volume |
Thu 23 October 2025 |
547.00 (0.18%) |
545.05 |
545.05 - 560.70 |
0.1633 times |
Fri 17 October 2025 |
546.00 (-2.01%) |
557.20 |
542.60 - 557.20 |
0.1895 times |
Fri 10 October 2025 |
557.20 (0.55%) |
557.70 |
542.95 - 593.95 |
1.8697 times |
Fri 03 October 2025 |
554.15 (2.13%) |
547.95 |
540.00 - 558.25 |
0.2269 times |
Fri 26 September 2025 |
542.60 (-2.05%) |
553.95 |
540.00 - 555.50 |
0.8173 times |
Fri 19 September 2025 |
553.95 (-0.4%) |
560.90 |
547.40 - 600.95 |
0.9845 times |
Fri 12 September 2025 |
556.20 (0.97%) |
552.05 |
550.70 - 560.85 |
0.5175 times |
Fri 05 September 2025 |
550.85 (6.56%) |
563.10 |
520.00 - 569.50 |
2.0504 times |
Fri 29 August 2025 |
516.95 (-5.1%) |
549.50 |
511.00 - 549.50 |
0.9856 times |
Fri 22 August 2025 |
544.75 (-6.26%) |
583.00 |
539.00 - 594.90 |
2.1955 times |
Thu 14 August 2025 |
581.15 (-1.47%) |
586.90 |
575.50 - 599.45 |
0.6292 times |

Monthly price and charts Uflex Strong monthly Stock price targets for Uflex 500148 are 517.28 and 570.48 | Monthly Target 1 | 507.37 | | Monthly Target 2 | 527.18 | | Monthly Target 3 | 560.56666666667 | | Monthly Target 4 | 580.38 | | Monthly Target 5 | 613.77 |
Monthly price and volumes Uflex
| Date |
Closing |
Open |
Range |
Volume |
Thu 23 October 2025 |
547.00 (0.58%) |
548.00 |
540.75 - 593.95 |
0.3038 times |
Tue 30 September 2025 |
543.85 (5.2%) |
563.10 |
520.00 - 600.95 |
0.5695 times |
Fri 29 August 2025 |
516.95 (-12.48%) |
588.35 |
511.00 - 604.70 |
0.5766 times |
Thu 31 July 2025 |
590.65 (-3.11%) |
616.45 |
582.65 - 630.00 |
0.5601 times |
Mon 30 June 2025 |
609.60 (-0.54%) |
614.00 |
583.55 - 647.95 |
0.9943 times |
Fri 30 May 2025 |
612.90 (10.86%) |
552.90 |
510.05 - 652.80 |
2.4355 times |
Wed 30 April 2025 |
552.85 (11.22%) |
502.00 |
473.15 - 577.00 |
0.8556 times |
Fri 28 March 2025 |
497.10 (10.41%) |
446.05 |
437.65 - 529.00 |
1.6402 times |
Fri 28 February 2025 |
450.25 (-5.29%) |
478.15 |
447.55 - 548.00 |
0.8396 times |
Fri 31 January 2025 |
475.40 (-8.43%) |
522.55 |
444.00 - 540.00 |
1.2248 times |
Tue 31 December 2024 |
519.15 (-3.12%) |
535.00 |
513.75 - 610.95 |
1.6225 times |

DMA SMA EMA moving averages of Uflex 500148
DMA (daily moving average) of Uflex 500148
| DMA period | DMA value | | 5 day DMA | 548.66 | | 12 day DMA | 550.75 | | 20 day DMA | 549.89 | | 35 day DMA | 551.21 | | 50 day DMA | 552.36 | | 100 day DMA | 577.89 | | 150 day DMA | 565.11 | | 200 day DMA | 544.75 | EMA (exponential moving average) of Uflex 500148
| EMA period | EMA current | EMA prev | EMA prev2 | | 5 day EMA | 549.09 | 550.14 | 548.36 | | 12 day EMA | 549.67 | 550.15 | 549.51 | | 20 day EMA | 550.51 | 550.88 | 550.58 | | 35 day EMA | 552.52 | 552.85 | 552.8 | | 50 day EMA | 554.46 | 554.76 | 554.8 |
SMA (simple moving average) of Uflex 500148
| SMA period | SMA current | SMA prev | SMA prev2 | | 5 day SMA | 548.66 | 548.25 | 546.32 | | 12 day SMA | 550.75 | 552.15 | 552.19 | | 20 day SMA | 549.89 | 550.03 | 549.83 | | 35 day SMA | 551.21 | 551.09 | 550.4 | | 50 day SMA | 552.36 | 553.22 | 553.76 | | 100 day SMA | 577.89 | 578.61 | 579.32 | | 150 day SMA | 565.11 | 564.56 | 563.94 | | 200 day SMA | 544.75 | 544.64 | 544.5 |
|
|
