DrReddy 500124 full analysis,charts,indicators,moving averages,SMA,DMA,EMA,ADX,MACD,RSIDr Reddy 500124 WideScreen charts, DMA,SMA,EMA technical analysis, forecast prediction, by indicators ADX,MACD,RSI,CCI BSE stock exchange
Daily price and charts and targets DrReddy Strong Daily Stock price targets for DrReddy 500124 are 1261.93 and 1289.93 | Daily Target 1 | 1255.95 | | Daily Target 2 | 1267.9 | | Daily Target 3 | 1283.95 | | Daily Target 4 | 1295.9 | | Daily Target 5 | 1311.95 |
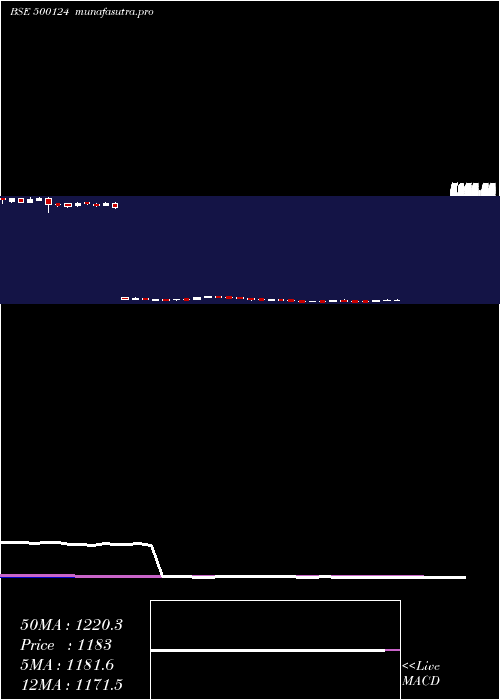
Daily price and volume Dr Reddy
| Date |
Closing |
Open |
Range |
Volume |
Thu 23 October 2025 |
1279.85 (-0.75%) |
1299.00 |
1272.00 - 1300.00 |
0.4108 times |
Tue 21 October 2025 |
1289.55 (0.56%) |
1285.05 |
1285.05 - 1294.45 |
0.0428 times |
Mon 20 October 2025 |
1282.40 (2.1%) |
1263.00 |
1259.60 - 1287.00 |
0.123 times |
Fri 17 October 2025 |
1256.00 (1.29%) |
1240.95 |
1238.25 - 1261.50 |
0.1045 times |
Thu 16 October 2025 |
1240.05 (0.61%) |
1232.30 |
1230.60 - 1242.35 |
0.0437 times |
Wed 15 October 2025 |
1232.50 (-0.38%) |
1238.00 |
1231.30 - 1241.80 |
0.1924 times |
Tue 14 October 2025 |
1237.25 (-1.96%) |
1268.25 |
1232.35 - 1268.25 |
8.4878 times |
Mon 13 October 2025 |
1261.95 (-0.23%) |
1250.95 |
1248.25 - 1264.75 |
0.3217 times |
Fri 10 October 2025 |
1264.80 (1.54%) |
1246.60 |
1245.00 - 1267.45 |
0.0893 times |
Thu 09 October 2025 |
1245.65 (0.91%) |
1240.10 |
1240.10 - 1263.85 |
0.1839 times |
Wed 08 October 2025 |
1234.40 (-1.18%) |
1242.20 |
1232.00 - 1250.20 |
0.0647 times |

Weekly price and charts DrReddy Strong weekly Stock price targets for DrReddy 500124 are 1269.73 and 1310.13 | Weekly Target 1 | 1239.42 | | Weekly Target 2 | 1259.63 | | Weekly Target 3 | 1279.8166666667 | | Weekly Target 4 | 1300.03 | | Weekly Target 5 | 1320.22 |
Weekly price and volumes for Dr Reddy
| Date |
Closing |
Open |
Range |
Volume |
Thu 23 October 2025 |
1279.85 (1.9%) |
1263.00 |
1259.60 - 1300.00 |
0.3226 times |
Fri 17 October 2025 |
1256.00 (-0.7%) |
1250.95 |
1230.60 - 1268.25 |
5.1189 times |
Fri 10 October 2025 |
1264.80 (1.34%) |
1238.20 |
1232.00 - 1267.45 |
0.5544 times |
Fri 03 October 2025 |
1248.10 (-0.37%) |
1255.15 |
1216.75 - 1268.45 |
0.6171 times |
Fri 26 September 2025 |
1252.75 (-5.29%) |
1322.00 |
1245.30 - 1322.00 |
0.3928 times |
Fri 19 September 2025 |
1322.70 (0.48%) |
1304.05 |
1293.15 - 1325.90 |
0.5977 times |
Fri 12 September 2025 |
1316.40 (3.77%) |
1269.00 |
1248.80 - 1320.50 |
0.3867 times |
Fri 05 September 2025 |
1268.55 (0.44%) |
1263.00 |
1247.20 - 1283.70 |
0.5662 times |
Fri 29 August 2025 |
1263.00 (-1.1%) |
1280.00 |
1241.70 - 1288.65 |
0.99 times |
Fri 22 August 2025 |
1277.00 (1.41%) |
1273.60 |
1237.30 - 1284.25 |
0.4535 times |
Thu 14 August 2025 |
1259.25 (3.93%) |
1211.20 |
1205.00 - 1265.70 |
0.1056 times |
Monthly price and charts DrReddy Strong monthly Stock price targets for DrReddy 500124 are 1252.65 and 1327.2 | Monthly Target 1 | 1193.88 | | Monthly Target 2 | 1236.87 | | Monthly Target 3 | 1268.4333333333 | | Monthly Target 4 | 1311.42 | | Monthly Target 5 | 1342.98 |
Monthly price and volumes Dr Reddy
| Date |
Closing |
Open |
Range |
Volume |
Thu 23 October 2025 |
1279.85 (4.59%) |
1225.45 |
1225.45 - 1300.00 |
2.7938 times |
Tue 30 September 2025 |
1223.70 (-3.11%) |
1263.00 |
1216.75 - 1325.90 |
0.9139 times |
Fri 29 August 2025 |
1263.00 (-0.62%) |
1261.30 |
1182.40 - 1288.65 |
0.8209 times |
Thu 31 July 2025 |
1270.85 (-1%) |
1283.95 |
1232.00 - 1314.00 |
0.79 times |
Mon 30 June 2025 |
1283.70 (2.55%) |
1248.15 |
1212.35 - 1377.95 |
0.6652 times |
Fri 30 May 2025 |
1251.75 (5.81%) |
1175.00 |
1121.20 - 1257.05 |
0.7526 times |
Wed 30 April 2025 |
1183.00 (3.4%) |
1144.00 |
1062.20 - 1210.45 |
0.7279 times |
Fri 28 March 2025 |
1144.05 (2.36%) |
1117.65 |
1093.00 - 1217.95 |
0.8855 times |
Fri 28 February 2025 |
1117.65 (-8.21%) |
1192.25 |
1105.00 - 1254.00 |
0.7375 times |
Fri 31 January 2025 |
1217.60 (-12.29%) |
1390.95 |
1165.00 - 1404.60 |
0.9128 times |
Tue 31 December 2024 |
1388.25 (15.46%) |
1210.05 |
1202.40 - 1398.70 |
0.8247 times |

DMA SMA EMA moving averages of Dr Reddy 500124
DMA (daily moving average) of Dr Reddy 500124
| DMA period | DMA value | | 5 day DMA | 1269.57 | | 12 day DMA | 1256.13 | | 20 day DMA | 1255.11 | | 35 day DMA | 1272.33 | | 50 day DMA | 1268.01 | | 100 day DMA | 1274.87 | | 150 day DMA | 1241.98 | | 200 day DMA | 1244.1 | EMA (exponential moving average) of Dr Reddy 500124
| EMA period | EMA current | EMA prev | EMA prev2 | | 5 day EMA | 1272.62 | 1269.01 | 1258.74 | | 12 day EMA | 1263.5 | 1260.53 | 1255.25 | | 20 day EMA | 1262.84 | 1261.05 | 1258.05 | | 35 day EMA | 1260.05 | 1258.88 | 1257.07 | | 50 day EMA | 1263.56 | 1262.9 | 1261.81 |
SMA (simple moving average) of Dr Reddy 500124
| SMA period | SMA current | SMA prev | SMA prev2 | | 5 day SMA | 1269.57 | 1260.1 | 1249.64 | | 12 day SMA | 1256.13 | 1253.52 | 1250.06 | | 20 day SMA | 1255.11 | 1256.52 | 1257.12 | | 35 day SMA | 1272.33 | 1271.68 | 1271.42 | | 50 day SMA | 1268.01 | 1266.65 | 1264.87 | | 100 day SMA | 1274.87 | 1274.55 | 1274.09 | | 150 day SMA | 1241.98 | 1241.04 | 1239.96 | | 200 day SMA | 1244.1 | 1244.45 | 1244.71 |
|
|
