StateBank 500112 full analysis,charts,indicators,moving averages,SMA,DMA,EMA,ADX,MACD,RSIState Bank 500112 WideScreen charts, DMA,SMA,EMA technical analysis, forecast prediction, by indicators ADX,MACD,RSI,CCI BSE stock exchange
Daily price and charts and targets StateBank Strong Daily Stock price targets for StateBank 500112 are 907.23 and 911.28 | Daily Target 1 | 904.23 | | Daily Target 2 | 906.17 | | Daily Target 3 | 908.28333333333 | | Daily Target 4 | 910.22 | | Daily Target 5 | 912.33 |
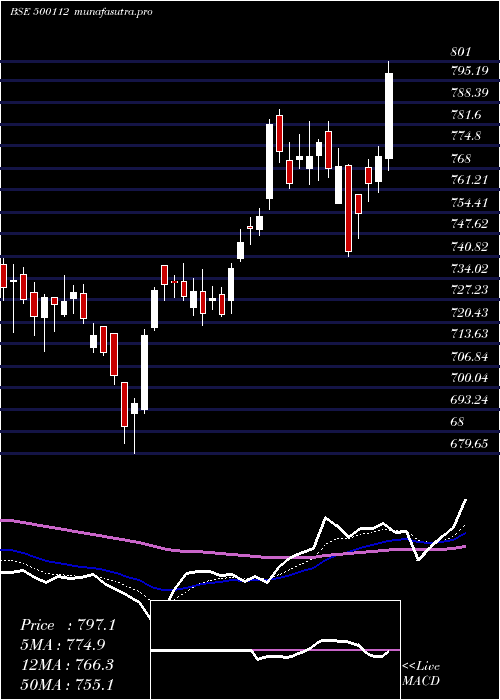
Daily price and volume State Bank
| Date |
Closing |
Open |
Range |
Volume |
Tue 21 October 2025 |
908.10 (0.14%) |
906.35 |
906.35 - 910.40 |
0.4375 times |
Mon 20 October 2025 |
906.85 (1.97%) |
893.70 |
891.55 - 913.40 |
1.1161 times |
Fri 17 October 2025 |
889.35 (0.28%) |
886.25 |
882.60 - 894.60 |
0.5834 times |
Thu 16 October 2025 |
886.90 (0.08%) |
886.75 |
882.50 - 891.90 |
1.4335 times |
Wed 15 October 2025 |
886.20 (1.06%) |
877.20 |
877.20 - 887.75 |
0.7542 times |
Tue 14 October 2025 |
876.90 (-0.69%) |
883.00 |
872.15 - 884.50 |
0.376 times |
Mon 13 October 2025 |
883.00 (0.26%) |
879.95 |
875.80 - 888.05 |
0.8286 times |
Fri 10 October 2025 |
880.75 (2.16%) |
861.20 |
861.20 - 883.70 |
1.7829 times |
Thu 09 October 2025 |
862.10 (0.47%) |
861.25 |
858.25 - 865.65 |
1.8009 times |
Wed 08 October 2025 |
858.05 (-0.77%) |
866.10 |
857.30 - 868.00 |
0.8869 times |
Tue 07 October 2025 |
864.70 (-1.07%) |
874.05 |
863.05 - 875.95 |
0.9562 times |
Weekly price and charts StateBank Strong weekly Stock price targets for StateBank 500112 are 899.83 and 921.68 | Weekly Target 1 | 882.5 | | Weekly Target 2 | 895.3 | | Weekly Target 3 | 904.35 | | Weekly Target 4 | 917.15 | | Weekly Target 5 | 926.2 |
Weekly price and volumes for State Bank
| Date |
Closing |
Open |
Range |
Volume |
Tue 21 October 2025 |
908.10 (2.11%) |
893.70 |
891.55 - 913.40 |
0.4655 times |
Fri 17 October 2025 |
889.35 (0.98%) |
879.95 |
872.15 - 894.60 |
1.1915 times |
Fri 10 October 2025 |
880.75 (1.58%) |
868.90 |
857.30 - 883.70 |
1.8876 times |
Fri 03 October 2025 |
867.05 (1.17%) |
857.05 |
855.90 - 877.50 |
1.5031 times |
Fri 26 September 2025 |
857.00 (-0.61%) |
862.90 |
851.10 - 880.40 |
0.9013 times |
Fri 19 September 2025 |
862.25 (4.73%) |
823.30 |
821.40 - 863.50 |
1.4361 times |
Fri 12 September 2025 |
823.30 (2.03%) |
807.10 |
805.40 - 825.50 |
0.9091 times |
Fri 05 September 2025 |
806.95 (0.57%) |
802.65 |
802.65 - 816.75 |
0.5456 times |
Fri 29 August 2025 |
802.35 (-1.68%) |
817.00 |
798.60 - 820.45 |
0.688 times |
Fri 22 August 2025 |
816.10 (-1.28%) |
831.35 |
815.55 - 835.20 |
0.4722 times |
Thu 14 August 2025 |
826.70 (2.75%) |
807.00 |
807.00 - 828.00 |
1.3077 times |

Monthly price and charts StateBank Strong monthly Stock price targets for StateBank 500112 are 882.7 and 938.8 | Monthly Target 1 | 836.83 | | Monthly Target 2 | 872.47 | | Monthly Target 3 | 892.93333333333 | | Monthly Target 4 | 928.57 | | Monthly Target 5 | 949.03 |
Monthly price and volumes State Bank
| Date |
Closing |
Open |
Range |
Volume |
Tue 21 October 2025 |
908.10 (4.07%) |
872.60 |
857.30 - 913.40 |
1.1342 times |
Tue 30 September 2025 |
872.55 (8.75%) |
802.65 |
802.65 - 880.40 |
0.9799 times |
Fri 29 August 2025 |
802.35 (0.74%) |
796.50 |
786.55 - 835.20 |
0.7938 times |
Thu 31 July 2025 |
796.45 (-2.91%) |
820.35 |
792.45 - 842.30 |
0.8648 times |
Mon 30 June 2025 |
820.35 (0.98%) |
812.10 |
781.50 - 824.40 |
1.0679 times |
Fri 30 May 2025 |
812.40 (3.08%) |
792.05 |
755.25 - 814.35 |
1.1487 times |
Wed 30 April 2025 |
788.15 (2.14%) |
767.95 |
740.75 - 835.40 |
0.8568 times |
Fri 28 March 2025 |
771.60 (12.11%) |
692.25 |
679.65 - 786.00 |
0.6377 times |
Fri 28 February 2025 |
688.25 (-10.98%) |
763.65 |
682.85 - 781.60 |
1.3146 times |
Fri 31 January 2025 |
773.10 (-2.76%) |
796.85 |
722.50 - 809.70 |
1.2015 times |
Tue 31 December 2024 |
795.05 (-5.24%) |
836.20 |
785.20 - 875.50 |
0.813 times |

DMA SMA EMA moving averages of State Bank 500112
DMA (daily moving average) of State Bank 500112
| DMA period | DMA value | | 5 day DMA | 895.48 | | 12 day DMA | 881.41 | | 20 day DMA | 875.28 | | 35 day DMA | 854.48 | | 50 day DMA | 843.33 | | 100 day DMA | 825.31 | | 150 day DMA | 808.67 | | 200 day DMA | 794.52 | EMA (exponential moving average) of State Bank 500112
| EMA period | EMA current | EMA prev | EMA prev2 | | 5 day EMA | 897.13 | 891.65 | 884.05 | | 12 day EMA | 885.04 | 880.85 | 876.12 | | 20 day EMA | 875.21 | 871.75 | 868.06 | | 35 day EMA | 860 | 857.17 | 854.24 | | 50 day EMA | 845.06 | 842.49 | 839.86 |
SMA (simple moving average) of State Bank 500112
| SMA period | SMA current | SMA prev | SMA prev2 | | 5 day SMA | 895.48 | 889.24 | 884.47 | | 12 day SMA | 881.41 | 877.99 | 874.43 | | 20 day SMA | 875.28 | 872.62 | 870.39 | | 35 day SMA | 854.48 | 851.56 | 848.57 | | 50 day SMA | 843.33 | 841.27 | 839.24 | | 100 day SMA | 825.31 | 824.19 | 823.06 | | 150 day SMA | 808.67 | 807.49 | 806.22 | | 200 day SMA | 794.52 | 794.08 | 793.61 |
|
|
