Bhel 500103 full analysis,charts,indicators,moving averages,SMA,DMA,EMA,ADX,MACD,RSIBhel 500103 WideScreen charts, DMA,SMA,EMA technical analysis, forecast prediction, by indicators ADX,MACD,RSI,CCI BSE stock exchange
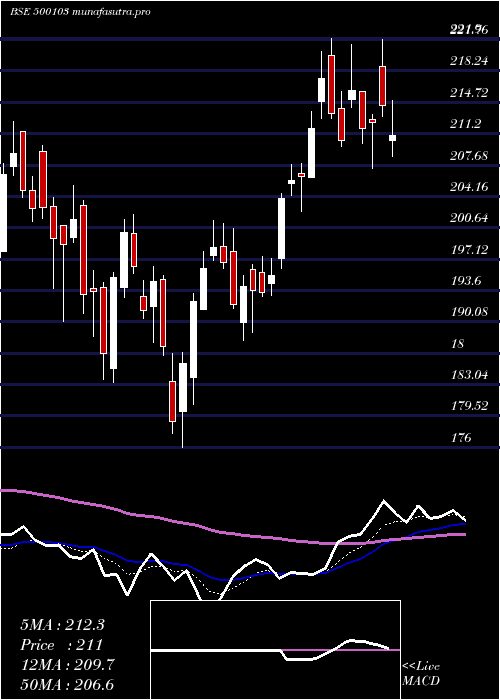
Daily price and charts and targets Bhel Strong Daily Stock price targets for Bhel 500103 are 234.13 and 236.28 | Daily Target 1 | 232.53 | | Daily Target 2 | 233.57 | | Daily Target 3 | 234.68333333333 | | Daily Target 4 | 235.72 | | Daily Target 5 | 236.83 |
Daily price and volume Bhel
| Date |
Closing |
Open |
Range |
Volume |
Tue 21 October 2025 |
234.60 (0.34%) |
233.65 |
233.65 - 235.80 |
0.4771 times |
Mon 20 October 2025 |
233.80 (0.47%) |
231.70 |
231.70 - 235.70 |
1.0532 times |
Fri 17 October 2025 |
232.70 (-1.44%) |
235.80 |
231.60 - 237.50 |
0.458 times |
Thu 16 October 2025 |
236.10 (0.13%) |
236.20 |
233.75 - 237.45 |
1.1167 times |
Wed 15 October 2025 |
235.80 (1.59%) |
232.10 |
232.10 - 237.90 |
0.5028 times |
Tue 14 October 2025 |
232.10 (-1.09%) |
235.55 |
230.40 - 236.05 |
0.7584 times |
Mon 13 October 2025 |
234.65 (-2.07%) |
237.05 |
234.00 - 239.10 |
1.244 times |
Fri 10 October 2025 |
239.60 (0.23%) |
239.30 |
239.00 - 242.40 |
1.4899 times |
Thu 09 October 2025 |
239.05 (0.1%) |
239.30 |
237.90 - 240.80 |
0.7445 times |
Wed 08 October 2025 |
238.80 (-2.49%) |
245.95 |
237.75 - 245.95 |
2.1553 times |
Tue 07 October 2025 |
244.90 (-0.24%) |
245.40 |
242.50 - 246.20 |
1.7858 times |
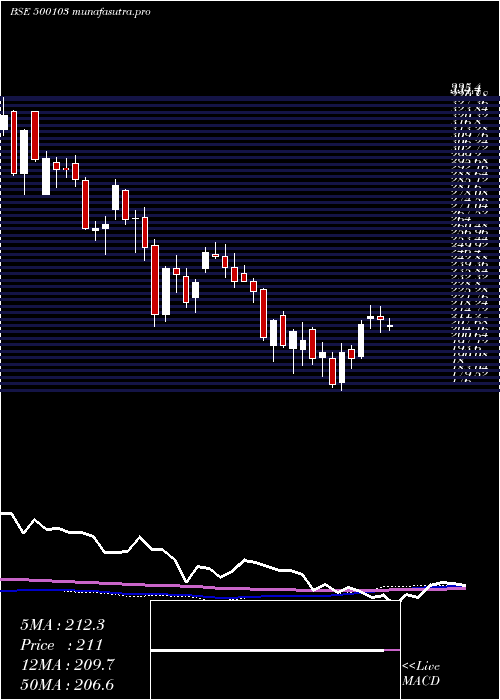
Weekly price and charts Bhel Strong weekly Stock price targets for Bhel 500103 are 233.15 and 237.25 | Weekly Target 1 | 229.93 | | Weekly Target 2 | 232.27 | | Weekly Target 3 | 234.03333333333 | | Weekly Target 4 | 236.37 | | Weekly Target 5 | 238.13 |
Weekly price and volumes for Bhel
| Date |
Closing |
Open |
Range |
Volume |
Tue 21 October 2025 |
234.60 (0.82%) |
231.70 |
231.70 - 235.80 |
0.1565 times |
Fri 17 October 2025 |
232.70 (-2.88%) |
237.05 |
230.40 - 239.10 |
0.4173 times |
Fri 10 October 2025 |
239.60 (-1.96%) |
244.35 |
237.75 - 246.70 |
0.7666 times |
Fri 03 October 2025 |
244.40 (5.85%) |
232.30 |
231.10 - 246.25 |
0.9408 times |
Fri 26 September 2025 |
230.90 (-2.8%) |
220.10 |
220.10 - 242.45 |
1.3917 times |
Fri 19 September 2025 |
237.55 (3.87%) |
230.05 |
228.35 - 241.30 |
0.7531 times |
Fri 12 September 2025 |
228.70 (7.67%) |
214.05 |
213.95 - 230.35 |
3.6833 times |
Fri 05 September 2025 |
212.40 (2.14%) |
209.30 |
209.30 - 222.20 |
0.7926 times |
Fri 29 August 2025 |
207.95 (-4.85%) |
219.25 |
205.20 - 219.65 |
0.3494 times |
Fri 22 August 2025 |
218.55 (-1.31%) |
225.05 |
216.10 - 225.40 |
0.7487 times |
Thu 14 August 2025 |
221.45 (-0.56%) |
222.75 |
220.00 - 226.90 |
0.3676 times |
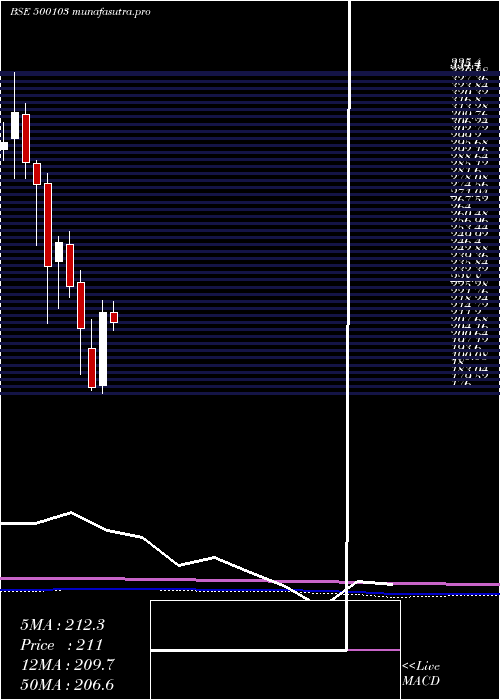
Monthly price and charts Bhel Strong monthly Stock price targets for Bhel 500103 are 224.35 and 240.65 | Monthly Target 1 | 220.93 | | Monthly Target 2 | 227.77 | | Monthly Target 3 | 237.23333333333 | | Monthly Target 4 | 244.07 | | Monthly Target 5 | 253.53 |
Monthly price and volumes Bhel
| Date |
Closing |
Open |
Range |
Volume |
Tue 21 October 2025 |
234.60 (-1.61%) |
238.85 |
230.40 - 246.70 |
0.3661 times |
Tue 30 September 2025 |
238.45 (14.67%) |
209.30 |
209.30 - 242.45 |
1.2068 times |
Fri 29 August 2025 |
207.95 (-12.74%) |
238.30 |
205.20 - 249.75 |
0.5132 times |
Thu 31 July 2025 |
238.30 (-10.5%) |
269.75 |
234.30 - 269.75 |
0.5434 times |
Mon 30 June 2025 |
266.25 (2.29%) |
260.85 |
243.55 - 272.00 |
1.069 times |
Fri 30 May 2025 |
260.30 (14.9%) |
227.00 |
210.40 - 269.10 |
1.8615 times |
Wed 30 April 2025 |
226.55 (4.86%) |
215.95 |
205.30 - 235.20 |
1.0718 times |
Fri 28 March 2025 |
216.05 (20.77%) |
180.00 |
176.00 - 221.90 |
0.9938 times |
Fri 28 February 2025 |
178.90 (-14.05%) |
198.05 |
177.55 - 212.55 |
1.0648 times |
Fri 31 January 2025 |
208.15 (-9.22%) |
230.95 |
185.20 - 236.85 |
1.3097 times |
Tue 31 December 2024 |
229.30 (-8.68%) |
250.15 |
223.65 - 256.50 |
1.0788 times |
DMA SMA EMA moving averages of Bhel 500103
DMA (daily moving average) of Bhel 500103
| DMA period | DMA value | | 5 day DMA | 234.6 | | 12 day DMA | 237.3 | | 20 day DMA | 237.24 | | 35 day DMA | 231.9 | | 50 day DMA | 227.59 | | 100 day DMA | 240.46 | | 150 day DMA | 234.7 | | 200 day DMA | 227.57 | EMA (exponential moving average) of Bhel 500103
| EMA period | EMA current | EMA prev | EMA prev2 | | 5 day EMA | 234.59 | 234.59 | 234.98 | | 12 day EMA | 235.66 | 235.85 | 236.22 | | 20 day EMA | 235.23 | 235.3 | 235.46 | | 35 day EMA | 232.62 | 232.5 | 232.42 | | 50 day EMA | 229.1 | 228.88 | 228.68 |
SMA (simple moving average) of Bhel 500103
| SMA period | SMA current | SMA prev | SMA prev2 | | 5 day SMA | 234.6 | 234.1 | 234.27 | | 12 day SMA | 237.3 | 238.12 | 238.65 | | 20 day SMA | 237.24 | 237.49 | 237.68 | | 35 day SMA | 231.9 | 231.26 | 230.52 | | 50 day SMA | 227.59 | 227.45 | 227.57 | | 100 day SMA | 240.46 | 240.78 | 241.04 | | 150 day SMA | 234.7 | 234.44 | 234.16 | | 200 day SMA | 227.57 | 227.6 | 227.6 |
|
|
