Cesc 500084 full analysis,charts,indicators,moving averages,SMA,DMA,EMA,ADX,MACD,RSICesc 500084 WideScreen charts, DMA,SMA,EMA technical analysis, forecast prediction, by indicators ADX,MACD,RSI,CCI BSE stock exchange
Daily price and charts and targets Cesc Strong Daily Stock price targets for Cesc 500084 are 180.05 and 182.6 | Daily Target 1 | 178.15 | | Daily Target 2 | 179.4 | | Daily Target 3 | 180.7 | | Daily Target 4 | 181.95 | | Daily Target 5 | 183.25 |
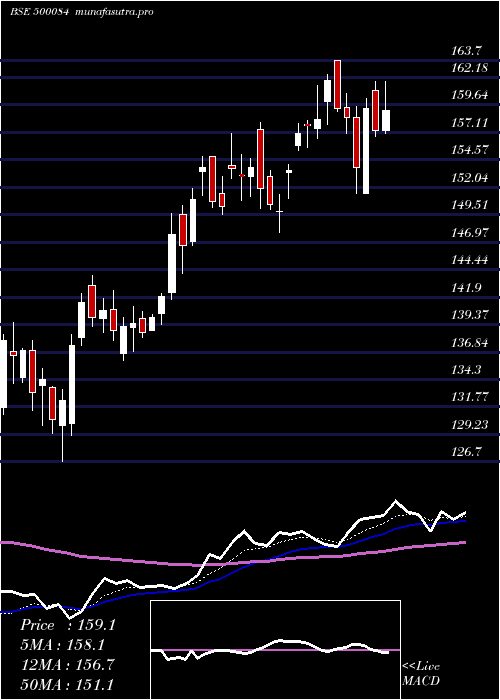
Daily price and volume Cesc
| Date |
Closing |
Open |
Range |
Volume |
Tue 21 October 2025 |
180.65 (0.84%) |
180.05 |
179.45 - 182.00 |
0.9142 times |
Mon 20 October 2025 |
179.15 (5.2%) |
175.95 |
170.45 - 179.95 |
1.2959 times |
Fri 17 October 2025 |
170.30 (-2.63%) |
174.35 |
170.10 - 174.60 |
0.216 times |
Thu 16 October 2025 |
174.90 (-0.68%) |
176.30 |
173.60 - 177.65 |
0.6054 times |
Wed 15 October 2025 |
176.10 (5.2%) |
168.05 |
168.05 - 176.80 |
1.9 times |
Tue 14 October 2025 |
167.40 (-2.02%) |
171.45 |
166.90 - 171.80 |
0.6873 times |
Mon 13 October 2025 |
170.85 (-0.12%) |
173.60 |
168.80 - 173.60 |
0.285 times |
Fri 10 October 2025 |
171.05 (0.44%) |
170.35 |
169.25 - 173.25 |
1.1776 times |
Thu 09 October 2025 |
170.30 (2.47%) |
166.25 |
165.15 - 171.40 |
1.3904 times |
Wed 08 October 2025 |
166.20 (2.15%) |
163.25 |
162.95 - 168.70 |
1.5282 times |
Tue 07 October 2025 |
162.70 (-2.19%) |
167.80 |
162.50 - 167.80 |
0.2384 times |
Weekly price and charts Cesc Strong weekly Stock price targets for Cesc 500084 are 175.55 and 187.1 | Weekly Target 1 | 166.15 | | Weekly Target 2 | 173.4 | | Weekly Target 3 | 177.7 | | Weekly Target 4 | 184.95 | | Weekly Target 5 | 189.25 |
Weekly price and volumes for Cesc
| Date |
Closing |
Open |
Range |
Volume |
Tue 21 October 2025 |
180.65 (6.08%) |
175.95 |
170.45 - 182.00 |
0.7013 times |
Fri 17 October 2025 |
170.30 (-0.44%) |
173.60 |
166.90 - 177.65 |
1.1721 times |
Fri 10 October 2025 |
171.05 (2.95%) |
167.45 |
162.50 - 173.25 |
1.4354 times |
Fri 03 October 2025 |
166.15 (1.56%) |
162.65 |
160.30 - 167.30 |
0.7921 times |
Fri 26 September 2025 |
163.60 (-3.48%) |
171.00 |
162.05 - 172.40 |
1.2906 times |
Fri 19 September 2025 |
169.50 (5.9%) |
161.60 |
161.60 - 171.45 |
1.1117 times |
Fri 12 September 2025 |
160.05 (4.17%) |
154.00 |
154.00 - 163.00 |
0.5083 times |
Fri 05 September 2025 |
153.65 (1.05%) |
153.00 |
152.45 - 158.00 |
0.5297 times |
Fri 29 August 2025 |
152.05 (-8.82%) |
167.40 |
151.70 - 171.10 |
1.7518 times |
Fri 22 August 2025 |
166.75 (2.3%) |
164.60 |
163.15 - 167.30 |
0.7069 times |
Thu 14 August 2025 |
163.00 (0.06%) |
163.00 |
160.35 - 166.25 |
0.3878 times |
Monthly price and charts Cesc Strong monthly Stock price targets for Cesc 500084 are 170.48 and 192.18 | Monthly Target 1 | 152.62 | | Monthly Target 2 | 166.63 | | Monthly Target 3 | 174.31666666667 | | Monthly Target 4 | 188.33 | | Monthly Target 5 | 196.02 |
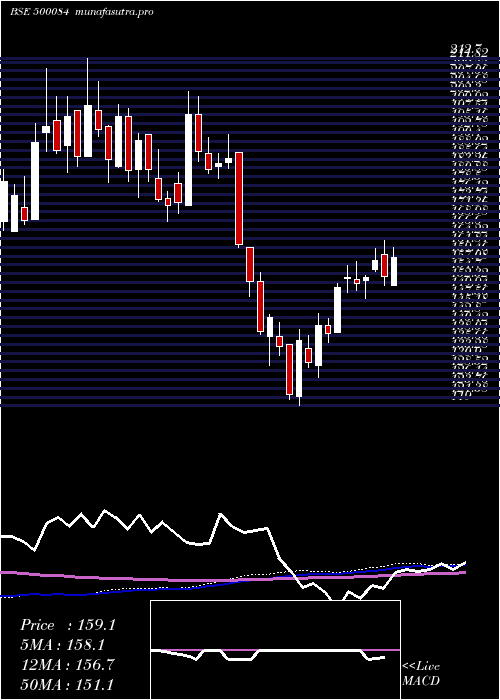
Monthly price and volumes Cesc
| Date |
Closing |
Open |
Range |
Volume |
Tue 21 October 2025 |
180.65 (11.48%) |
161.05 |
160.30 - 182.00 |
0.7383 times |
Tue 30 September 2025 |
162.05 (6.58%) |
153.00 |
152.45 - 172.40 |
0.7945 times |
Fri 29 August 2025 |
152.05 (-10.51%) |
169.20 |
151.70 - 171.10 |
0.9236 times |
Thu 31 July 2025 |
169.90 (-1.05%) |
171.80 |
167.60 - 183.10 |
1.2593 times |
Mon 30 June 2025 |
171.70 (5.69%) |
164.00 |
160.80 - 174.65 |
0.9122 times |
Fri 30 May 2025 |
162.45 (2.11%) |
158.35 |
153.45 - 176.40 |
1.043 times |
Wed 30 April 2025 |
159.10 (3.45%) |
153.15 |
147.90 - 163.70 |
0.5111 times |
Fri 28 March 2025 |
153.80 (17.76%) |
130.05 |
126.70 - 157.00 |
0.923 times |
Fri 28 February 2025 |
130.60 (-8.64%) |
137.70 |
119.00 - 141.55 |
0.8131 times |
Fri 31 January 2025 |
142.95 (-23.06%) |
185.95 |
129.95 - 192.30 |
2.0818 times |
Tue 31 December 2024 |
185.80 (6.78%) |
173.05 |
173.05 - 203.80 |
1.5803 times |

DMA SMA EMA moving averages of Cesc 500084
DMA (daily moving average) of Cesc 500084
| DMA period | DMA value | | 5 day DMA | 176.22 | | 12 day DMA | 171.33 | | 20 day DMA | 168.67 | | 35 day DMA | 165.47 | | 50 day DMA | 164.41 | | 100 day DMA | 168.09 | | 150 day DMA | 164.22 | | 200 day DMA | 160.46 | EMA (exponential moving average) of Cesc 500084
| EMA period | EMA current | EMA prev | EMA prev2 | | 5 day EMA | 176.32 | 174.15 | 171.65 | | 12 day EMA | 172.54 | 171.07 | 169.6 | | 20 day EMA | 170.14 | 169.03 | 167.97 | | 35 day EMA | 167.52 | 166.75 | 166.02 | | 50 day EMA | 165.59 | 164.98 | 164.4 |
SMA (simple moving average) of Cesc 500084
| SMA period | SMA current | SMA prev | SMA prev2 | | 5 day SMA | 176.22 | 173.57 | 171.91 | | 12 day SMA | 171.33 | 170.12 | 168.73 | | 20 day SMA | 168.67 | 168.05 | 167.57 | | 35 day SMA | 165.47 | 164.77 | 163.99 | | 50 day SMA | 164.41 | 164.12 | 163.76 | | 100 day SMA | 168.09 | 167.95 | 167.83 | | 150 day SMA | 164.22 | 163.96 | 163.68 | | 200 day SMA | 160.46 | 160.48 | 160.5 |
|
|
