DisaIndia 500068 full analysis,charts,indicators,moving averages,SMA,DMA,EMA,ADX,MACD,RSIDisa India 500068 WideScreen charts, DMA,SMA,EMA technical analysis, forecast prediction, by indicators ADX,MACD,RSI,CCI BSE stock exchange
Daily price and charts and targets DisaIndia Strong Daily Stock price targets for DisaIndia 500068 are 12566.1 and 12785.05 | Daily Target 1 | 12391.77 | | Daily Target 2 | 12521.48 | | Daily Target 3 | 12610.716666667 | | Daily Target 4 | 12740.43 | | Daily Target 5 | 12829.67 |
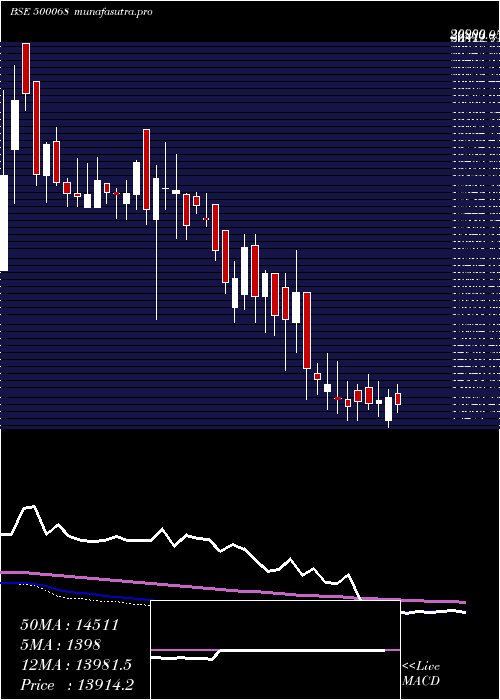
Daily price and volume Disa India
| Date |
Closing |
Open |
Range |
Volume |
Fri 05 December 2025 |
12651.20 (1.39%) |
12481.00 |
12481.00 - 12699.95 |
0.412 times |
Thu 04 December 2025 |
12477.90 (0.22%) |
12649.00 |
12431.00 - 12649.00 |
0.2154 times |
Wed 03 December 2025 |
12451.00 (-0.87%) |
12600.00 |
12431.00 - 12666.90 |
0.2809 times |
Tue 02 December 2025 |
12560.45 (0.14%) |
12749.95 |
12500.05 - 12749.95 |
0.3558 times |
Mon 01 December 2025 |
12543.50 (-1.48%) |
12800.00 |
12500.05 - 12800.00 |
1.9288 times |
Fri 28 November 2025 |
12732.05 (1.71%) |
12508.55 |
12500.00 - 12755.00 |
2.3408 times |
Thu 27 November 2025 |
12518.15 (-1.37%) |
12691.65 |
12499.00 - 12691.65 |
1.0206 times |
Wed 26 November 2025 |
12691.65 (-1.14%) |
12506.00 |
12343.00 - 12800.00 |
2.7434 times |
Tue 25 November 2025 |
12837.60 (0.41%) |
12998.90 |
12499.00 - 12998.90 |
0.515 times |
Mon 24 November 2025 |
12785.00 (-0.57%) |
12800.00 |
12749.00 - 12800.00 |
0.1873 times |
Fri 21 November 2025 |
12858.30 (-0.71%) |
12885.25 |
12282.00 - 13000.00 |
1.0674 times |

Weekly price and charts DisaIndia Strong weekly Stock price targets for DisaIndia 500068 are 12356.6 and 12725.6 | Weekly Target 1 | 12258.4 | | Weekly Target 2 | 12454.8 | | Weekly Target 3 | 12627.4 | | Weekly Target 4 | 12823.8 | | Weekly Target 5 | 12996.4 |
Weekly price and volumes for Disa India
| Date |
Closing |
Open |
Range |
Volume |
Fri 05 December 2025 |
12651.20 (-0.64%) |
12800.00 |
12431.00 - 12800.00 |
0.7392 times |
Fri 28 November 2025 |
12732.05 (-0.98%) |
12800.00 |
12343.00 - 12998.90 |
1.576 times |
Fri 21 November 2025 |
12858.30 (-3.69%) |
13479.90 |
12282.00 - 13479.90 |
1.9727 times |
Fri 14 November 2025 |
13350.35 (-1.75%) |
13749.00 |
13201.00 - 13899.00 |
0.8454 times |
Fri 07 November 2025 |
13588.60 (-0.88%) |
13890.00 |
13400.00 - 13890.00 |
0.8498 times |
Fri 31 October 2025 |
13709.85 (-0.22%) |
13650.00 |
13430.00 - 13729.80 |
0.6178 times |
Thu 23 October 2025 |
13739.90 (1.02%) |
13425.25 |
13425.25 - 13824.90 |
0.2775 times |
Fri 17 October 2025 |
13601.35 (-1.2%) |
13766.50 |
13506.45 - 13989.00 |
0.8064 times |
Fri 10 October 2025 |
13766.50 (0.63%) |
13680.05 |
13512.65 - 13909.00 |
1.8383 times |
Fri 03 October 2025 |
13680.00 (0.4%) |
13600.05 |
13452.05 - 13947.75 |
0.4769 times |
Fri 26 September 2025 |
13625.00 (-3.92%) |
13900.05 |
13520.00 - 14179.95 |
2.2848 times |
Monthly price and charts DisaIndia Strong monthly Stock price targets for DisaIndia 500068 are 12356.6 and 12725.6 | Monthly Target 1 | 12258.4 | | Monthly Target 2 | 12454.8 | | Monthly Target 3 | 12627.4 | | Monthly Target 4 | 12823.8 | | Monthly Target 5 | 12996.4 |
Monthly price and volumes Disa India
| Date |
Closing |
Open |
Range |
Volume |
Fri 05 December 2025 |
12651.20 (-0.64%) |
12800.00 |
12431.00 - 12800.00 |
0.1288 times |
Fri 28 November 2025 |
12732.05 (-7.13%) |
13890.00 |
12282.00 - 13899.00 |
0.9137 times |
Fri 31 October 2025 |
13709.85 (1.57%) |
13800.00 |
13425.25 - 13989.00 |
0.6289 times |
Tue 30 September 2025 |
13497.80 (0.38%) |
13750.00 |
13355.05 - 14693.00 |
1.064 times |
Fri 29 August 2025 |
13446.45 (-5.87%) |
14250.00 |
13100.05 - 14690.00 |
0.9631 times |
Thu 31 July 2025 |
14285.00 (1.69%) |
14048.00 |
13749.00 - 15050.00 |
1.2989 times |
Mon 30 June 2025 |
14048.00 (0.5%) |
13999.95 |
13201.00 - 14505.80 |
1.4322 times |
Fri 30 May 2025 |
13977.65 (1.37%) |
13900.00 |
13612.00 - 15800.00 |
1.3692 times |
Wed 30 April 2025 |
13789.00 (-0.98%) |
13926.15 |
13471.00 - 14600.00 |
0.616 times |
Fri 28 March 2025 |
13925.15 (-2.62%) |
14026.00 |
13600.05 - 14750.00 |
1.5852 times |
Fri 28 February 2025 |
14300.00 (-8.06%) |
15502.00 |
13810.00 - 16890.00 |
1.1456 times |
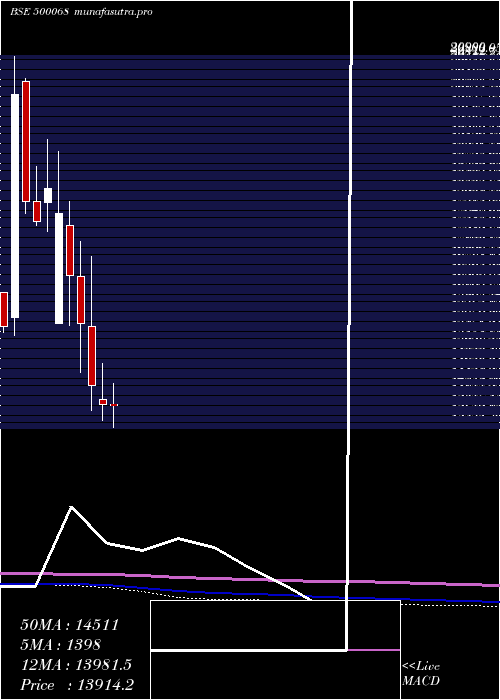
DMA SMA EMA moving averages of Disa India 500068
DMA (daily moving average) of Disa India 500068
| DMA period | DMA value | | 5 day DMA | 12536.81 | | 12 day DMA | 12671.4 | | 20 day DMA | 12934.13 | | 35 day DMA | 13240.33 | | 50 day DMA | 13400.31 | | 100 day DMA | 13724.4 | | 150 day DMA | 13824.22 | | 200 day DMA | 13950.34 | EMA (exponential moving average) of Disa India 500068
| EMA period | EMA current | EMA prev | EMA prev2 | | 5 day EMA | 12577.57 | 12540.76 | 12572.19 | | 12 day EMA | 12711.06 | 12721.94 | 12766.29 | | 20 day EMA | 12881.76 | 12906.02 | 12951.06 | | 35 day EMA | 13119.05 | 13146.59 | 13185.96 | | 50 day EMA | 13359.8 | 13388.71 | 13425.87 |
SMA (simple moving average) of Disa India 500068
| SMA period | SMA current | SMA prev | SMA prev2 | | 5 day SMA | 12536.81 | 12552.98 | 12561.03 | | 12 day SMA | 12671.4 | 12699.48 | 12745.8 | | 20 day SMA | 12934.13 | 12977.93 | 13031.2 | | 35 day SMA | 13240.33 | 13271.72 | 13308.54 | | 50 day SMA | 13400.31 | 13430.9 | 13460.94 | | 100 day SMA | 13724.4 | 13739.66 | 13757.61 | | 150 day SMA | 13824.22 | 13832.88 | 13842.56 | | 200 day SMA | 13950.34 | 13962.72 | 13978.1 |
|
|
